Adaptive Learning Optimizers For Neural Networks
# Loading Libraries
import time
import matplotlib.pyplot as plt
import numpy as np
from keras.models import Sequential
from keras.layers.core import Dense, Activation
from keras.optimizers import SGD
from keras.utils import np_utils
import matplotlib as mpl
import seaborn as sns
sns.set_style("ticks", {"xtick.direction": u"in", "ytick.direction": u"in"})
np.random.seed(1367)
Using TensorFlow backend.
from keras.datasets import mnist
(train_features, train_labels), (test_features, test_labels) = mnist.load_data()
_, img_rows, img_cols =  train_features.shape
num_classes = len(np.unique(train_labels))
num_input_nodes = img_rows*img_cols
print "Number of training samples: %d"%train_features.shape[0]
print "Number of test samples: %d"%test_features.shape[0]
print "Image rows: %d"%train_features.shape[1]
print "Image columns: %d"%train_features.shape[2]
print "Number of classes: %d"%num_classes
Number of training samples: 60000
Number of test samples: 10000
Image rows: 28
Image columns: 28
Number of classes: 10
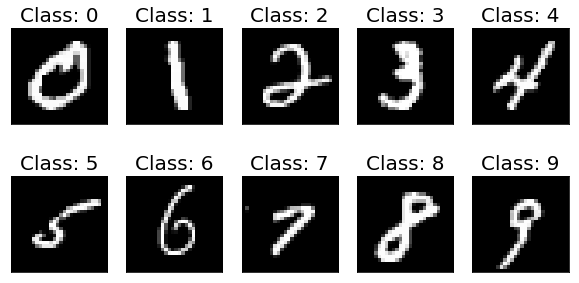
fig = plt.figure(figsize=(10,5))
for i in range(num_classes):
    ax = fig.add_subplot(2, 5, 1 + i, xticks=[], yticks=[])
    features_idx = train_features[train_labels[:]==i,:]
    ax.set_title("Class: " + str(i) , fontsize = 20)
    plt.imshow(features_idx[1], cmap="gray")
plt.savefig("./mnist.png" , bbox_inches='tight')
plt.show()
# reshape images to column vectors
train_features = train_features.reshape(train_features.shape[0], img_rows*img_cols)
test_features = test_features.reshape(test_features.shape[0], img_rows*img_cols)
# convert class labels to binary class labels
train_labels = np_utils.to_categorical(train_labels, num_classes)
test_labels = np_utils.to_categorical(test_labels, num_classes)
def simple_nn():
    # initialize model
    model = Sequential()
    # add an input layer and a hidden layer
    model.add(Dense(100, input_dim = num_input_nodes))
    # add activation layer to add non-linearity
    model.add(Activation('sigmoid'))
    # to add ReLu instead of sigmoid: model.add(Activation('relu'))
    # combine above 2 layers: model.add(Dense(100, input_dim=784),Activation('sigmoid'))
    # add output layer
    model.add(Dense(num_classes))
    # add softmax layer
    model.add(Activation('softmax'))
    return model
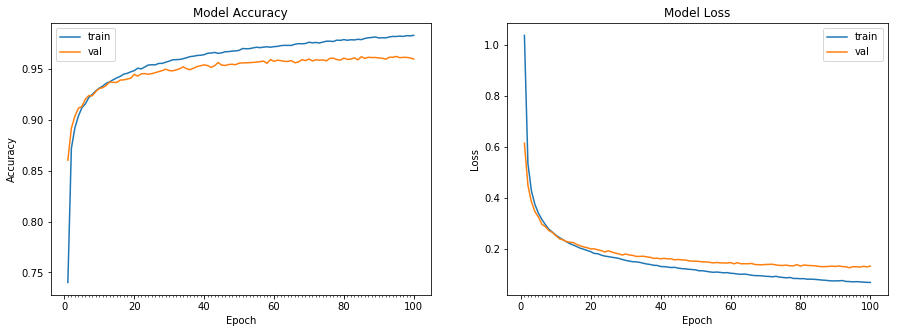
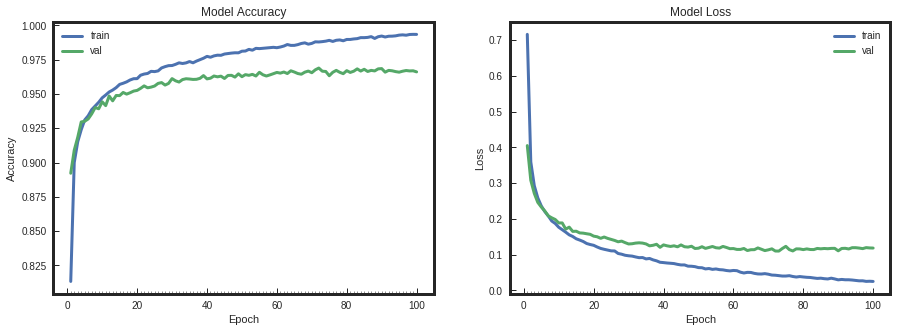
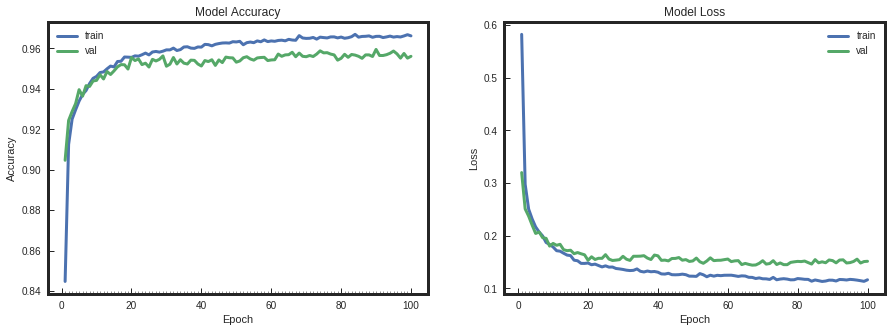
def plot_model_history(model_history):
    fig, axs = plt.subplots(1,2,figsize=(15,5))
    # summarize history for accuracy
    axs[0].plot(range(1,len(model_history.history['acc'])+1),model_history.history['acc'])
    axs[0].plot(range(1,len(model_history.history['val_acc'])+1),model_history.history['val_acc'])
    axs[0].set_title('Model Accuracy')
    axs[0].set_ylabel('Accuracy')
    axs[0].set_xlabel('Epoch')
    axs[0].set_xticks(np.arange(1,len(model_history.history['acc'])+1),len(model_history.history['acc'])/10)
    axs[0].legend(['train', 'val'], loc='best')
    # summarize history for loss
    axs[1].plot(range(1,len(model_history.history['loss'])+1),model_history.history['loss'])
    axs[1].plot(range(1,len(model_history.history['val_loss'])+1),model_history.history['val_loss'])
    axs[1].set_title('Model Loss')
    axs[1].set_ylabel('Loss')
    axs[1].set_xlabel('Epoch')
    axs[1].set_xticks(np.arange(1,len(model_history.history['loss'])+1),len(model_history.history['loss'])/10)
    axs[1].legend(['train', 'val'], loc='best')
    plt.show()
def accuracy(test_x, test_y, model):
    result = model.predict(test_x)
    predicted_class = np.argmax(result, axis=1)
    true_class = np.argmax(test_y, axis=1)
    num_correct = np.sum(predicted_class == true_class)
    accuracy = float(num_correct)/result.shape[0]
    return (accuracy * 100)
# decrease the learning rate
# define model
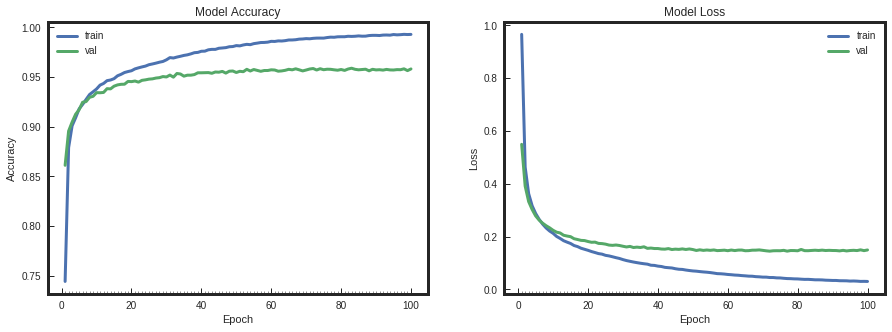
model_sgd = simple_nn()
model_sgd.compile(optimizer="SGD", loss='categorical_crossentropy', metrics=['accuracy'])
start = time.time()
model_info_sgd = model_sgd.fit(train_features, train_labels, batch_size=128, \
nb_epoch=100, verbose=0, validation_data=(test_features , test_labels))
end = time.time()
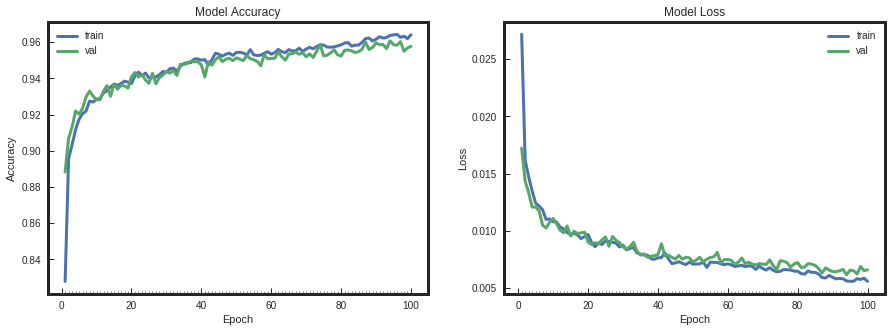
# plot model history
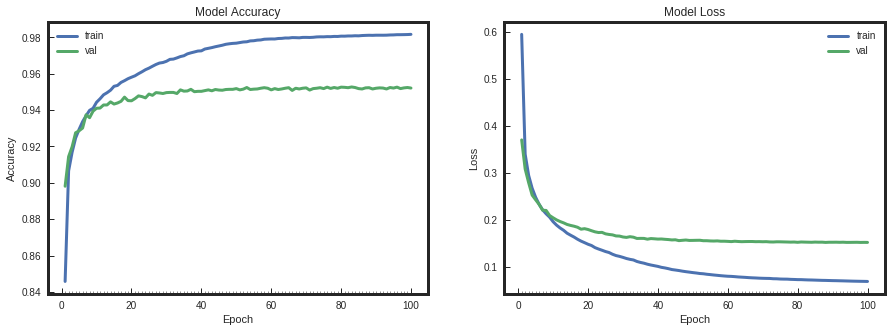
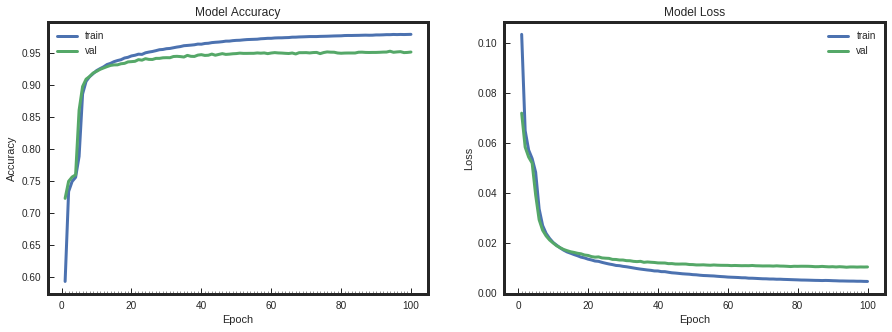
plot_model_history(model_info_sgd)
print "SGD Model took %0.2f seconds to train"%(end - start)
# compute test accuracy
print "SGD Accuracy on test data is: %0.2f"%accuracy(test_features, test_labels, model)
SGD Model took 102.65 seconds to train
SGD Accuracy on test data is: 94.28
# decrease the learning rate
# define model
model_adagrad = simple_nn()
model_adagrad.compile(optimizer="Adagrad", loss='categorical_crossentropy', metrics=['accuracy'])
start = time.time()
model_info_adagrad = model_adagrad.fit(train_features, train_labels, batch_size=128, \
nb_epoch=100, verbose=0, validation_data=(test_features , test_labels))
end = time.time()
# plot model history
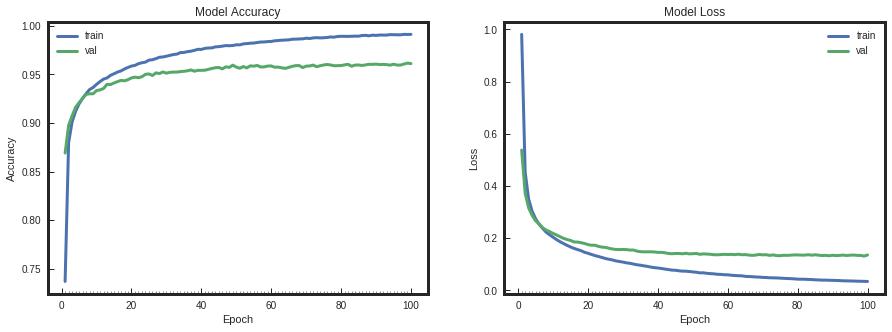
plot_model_history(model_info_adagrad)
print "Adagrad Model took %0.2f seconds to train"%(end - start)
# compute test accuracy
print "adagrad Accuracy on test data is: %0.2f"%accuracy(test_features, test_labels, model)
Adagrad Model took 166.58 seconds to train
adagrad Accuracy on test data is: 94.28
# decrease the learning rate
# define model
model_adadelta = simple_nn()
model_adadelta.compile(optimizer="Adadelta", loss='categorical_crossentropy', metrics=['accuracy'])
start = time.time()
model_info_adadelta = model_adadelta.fit(train_features, train_labels, batch_size=128, \
nb_epoch=100, verbose=0, validation_data=(test_features , test_labels))
end = time.time()
# plot model history
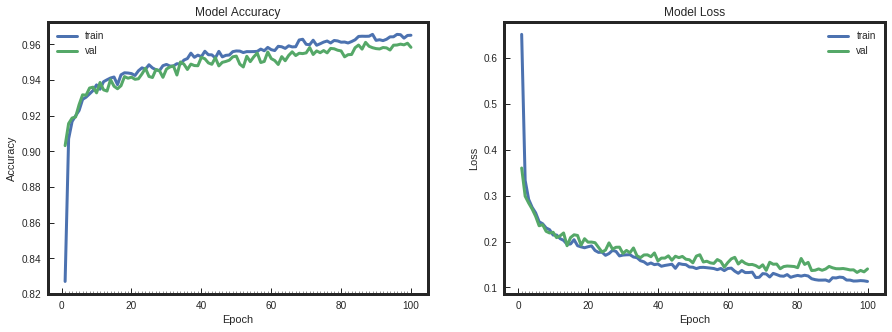
plot_model_history(model_info_adadelta)
print "Adadelta Model took %0.2f seconds to train"%(end - start)
# compute test accuracy
print "adadelta Accuracy on test data is: %0.2f"%accuracy(test_features, test_labels, model)
Adadelta Model took 176.11 seconds to train
adadelta Accuracy on test data is: 94.28
# decrease the learning rate
# define model
model_adam = simple_nn()
model_adam.compile(optimizer="Adam", loss='categorical_crossentropy', metrics=['accuracy'])
start = time.time()
model_info_adam = model_adam.fit(train_features, train_labels, batch_size=128, \
nb_epoch=100, verbose=0, validation_data=(test_features , test_labels))
end = time.time()
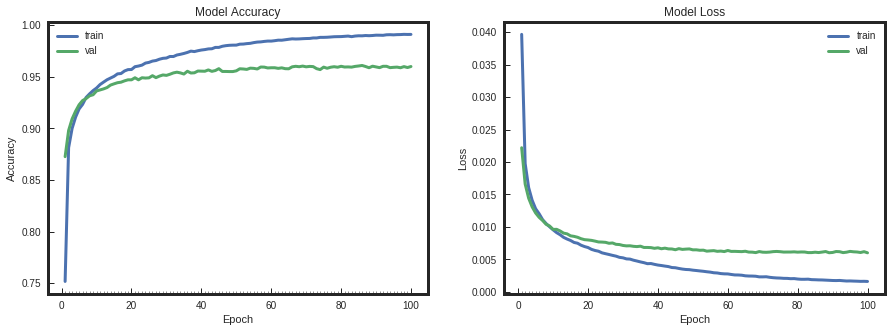
# plot model history
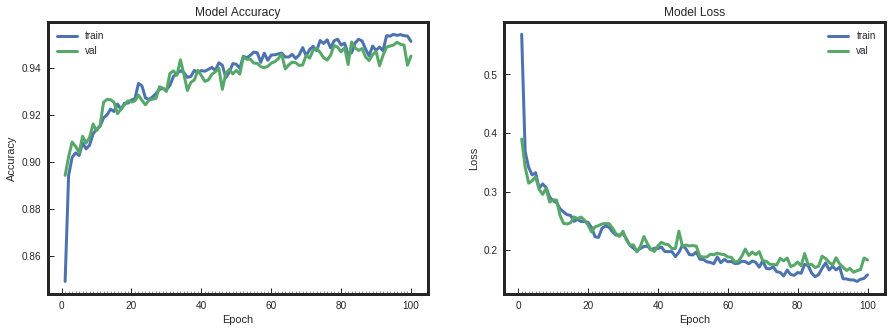
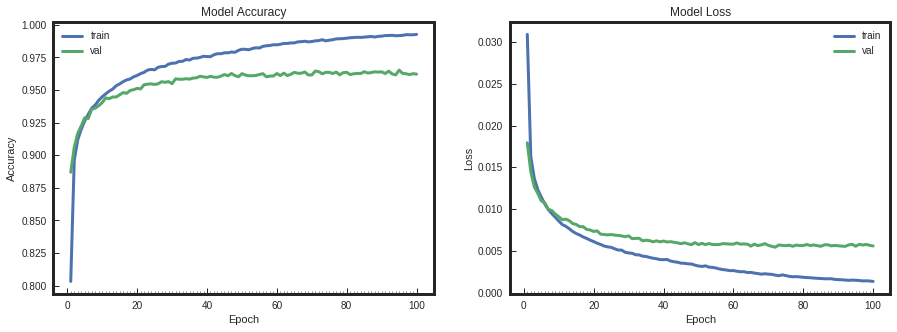
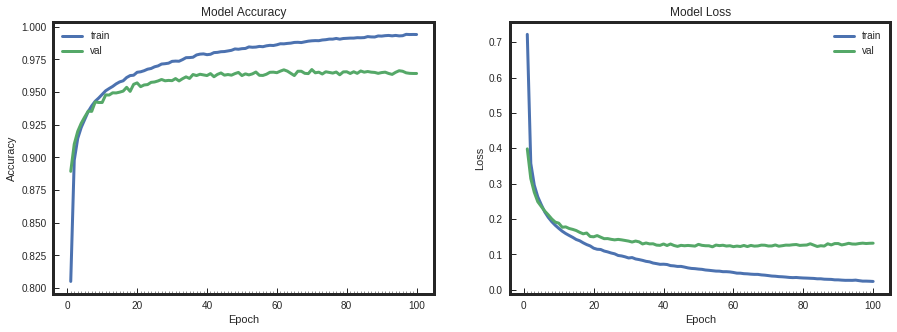
plot_model_history(model_info_adam)
print "Adam Model took %0.2f seconds to train"%(end - start)
# compute test accuracy
print "Adam Accuracy on test data is: %0.2f"%accuracy(test_features, test_labels, model)
Adam Model took 189.46 seconds to train
Adam Accuracy on test data is: 94.28
# decrease the learning rate
# define model
model_nadam = simple_nn()
model_nadam.compile(optimizer="Nadam", loss='categorical_crossentropy', metrics=['accuracy'])
start = time.time()
model_info_nadam = model_nadam.fit(train_features, train_labels, batch_size=128, \
nb_epoch=100, verbose=0, validation_data=(test_features , test_labels))
end = time.time()
# plot model history
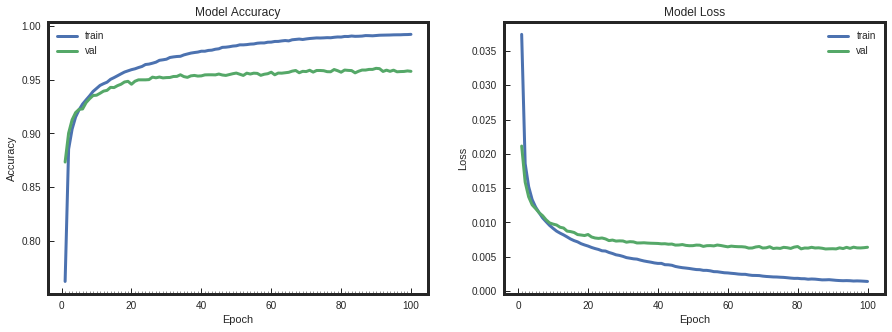
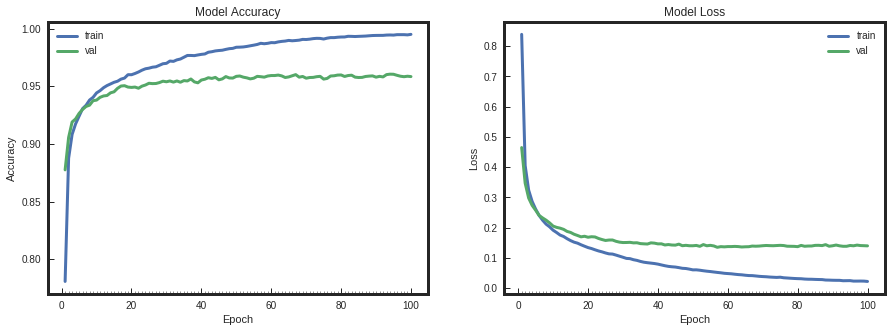
plot_model_history(model_info_nadam)
print "Nadam Model took %0.2f seconds to train"%(end - start)
# compute test accuracy
print "Nadam Accuracy on test data is: %0.2f"%accuracy(test_features, test_labels, model_nadam)
Nadam Model took 260.45 seconds to train
Nadam Accuracy on test data is: 94.52
# decrease the learning rate
# define model
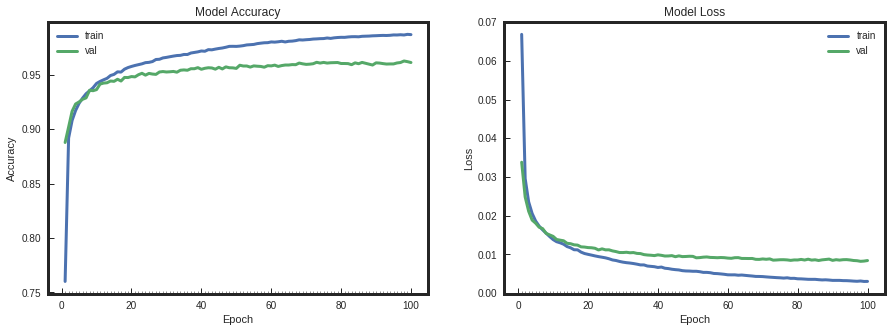
model_adamax = simple_nn()
model_adamax.compile(optimizer="Adamax", loss='categorical_crossentropy', metrics=['accuracy'])
start = time.time()
model_info_adamax = model_adamax.fit(train_features, train_labels, batch_size=128, \
nb_epoch=100, verbose=0, validation_data=(test_features , test_labels))
end = time.time()
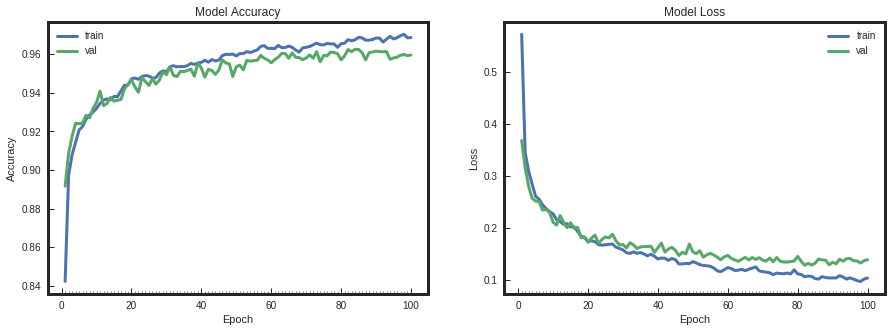
# plot model history
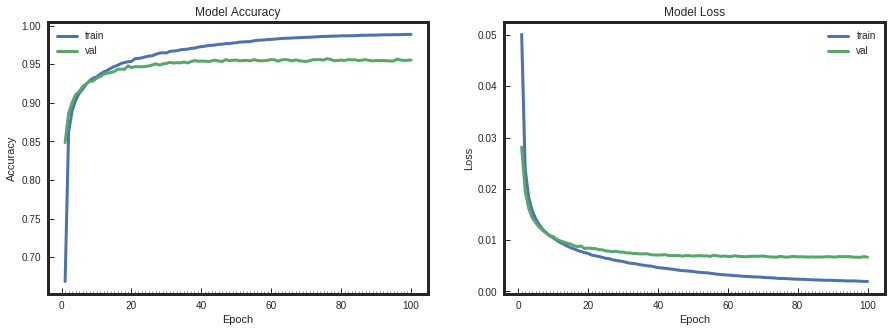
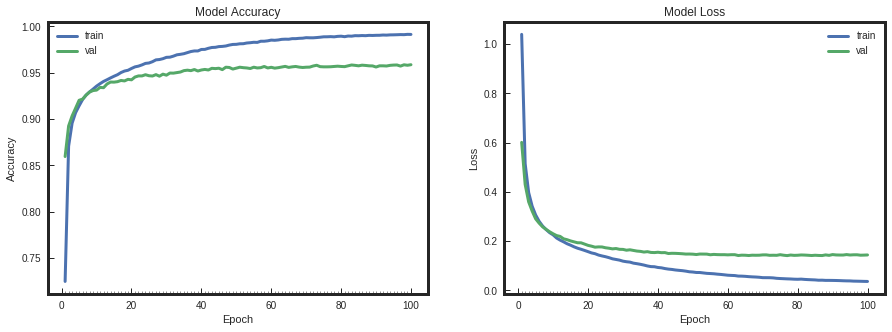
plot_model_history(model_info_adamax)
print "Nadam Model took %0.2f seconds to train"%(end - start)
# compute test accuracy
print "Adamax Accuracy on test data is: %0.2f"%accuracy(test_features, test_labels, model_adamax)
Nadam Model took 184.97 seconds to train
Adamax Accuracy on test data is: 96.61
# decrease the learning rate
# define model
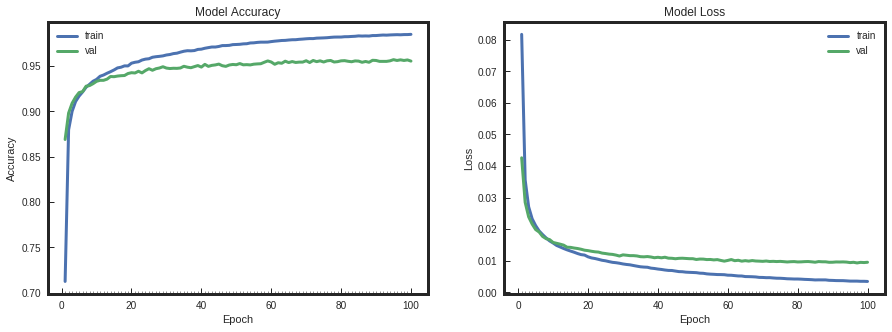
model_rmsprop = simple_nn()
model_rmsprop.compile(optimizer="RMSprop", loss='categorical_crossentropy', metrics=['accuracy'])
start = time.time()
model_info_rmsprop = model_rmsprop.fit(train_features, train_labels, batch_size=128, \
nb_epoch=100, verbose=0, validation_data=(test_features , test_labels))
end = time.time()
# plot model history
plot_model_history(model_info_rmsprop)
print "RMSprop Model took %0.2f seconds to train"%(end - start)
# compute test accuracy
print "RMSprop Accuracy on test data is: %0.2f"%accuracy(test_features, test_labels, model_rmsprop)
RMSprop Model took 172.51 seconds to train
RMSprop Accuracy on test data is: 95.61
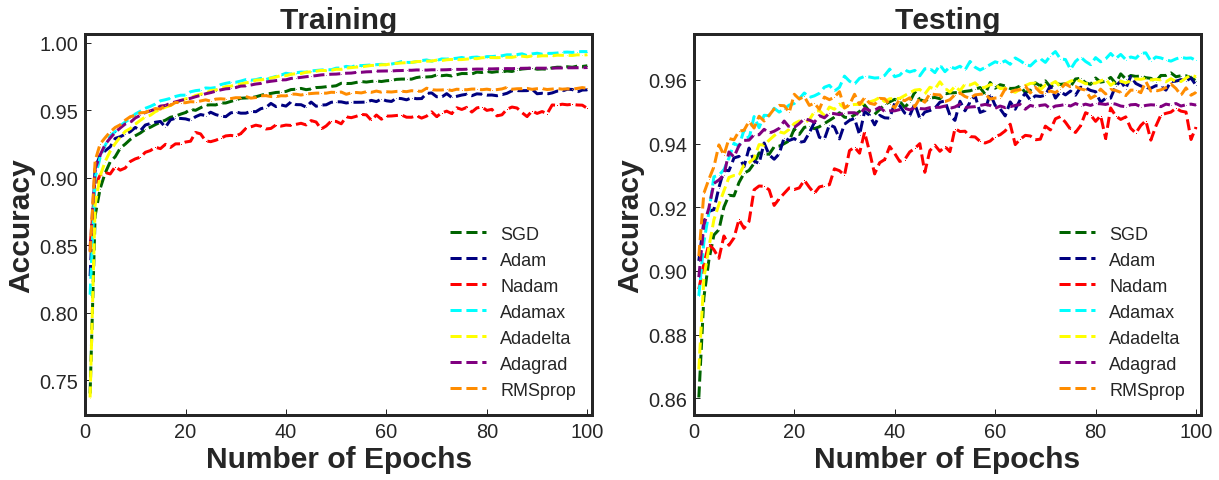
# Plot with Error bars
plt.figure(figsize=(20, 7))

plt.subplot(1,2,1)
plt.errorbar(range(1,len(model_info_sgd.history['acc'])+1),model_info_sgd.history['acc'] ,color = "DarkGreen", linestyle = "--" , marker = "v" , label = "SGD")
plt.errorbar(range(1,len(model_info_adam.history['acc'])+1),model_info_adam.history['acc'] ,color = "navy", linestyle = "--" , marker = "^" , label = "Adam")
plt.errorbar(range(1,len(model_info_nadam.history['acc'])+1),model_info_nadam.history['acc'] ,color = "red", linestyle = "--" , marker = "s" , label = "Nadam")
plt.errorbar(range(1,len(model_info_adamax.history['acc'])+1),model_info_adamax.history['acc'] ,color = "cyan", linestyle = "--" , marker = "h" , label = "Adamax")
plt.errorbar(range(1,len(model_info_adadelta.history['acc'])+1),model_info_adadelta.history['acc'] ,color = "yellow", linestyle = "--" , marker = ">" , label = "Adadelta")
plt.errorbar(range(1,len(model_info_adagrad.history['acc'])+1),model_info_adagrad.history['acc'],color = "purple", linestyle = "--" , marker = "<" , label = "Adagrad")
plt.errorbar(range(1,len(model_info_rmsprop.history['acc'])+1),model_info_rmsprop.history['acc'] ,color = "darkorange", linestyle = "--" , marker = "o" , label = "RMSprop")

plt.title("Training" ,  fontweight = "bold" , fontsize=30)

mpl.rcParams['lines.markersize'] = 1
mpl.rcParams['axes.linewidth'] = 3
mpl.rcParams['lines.linewidth'] =3
plt.xlabel("Number of Epochs", fontweight = "bold" , fontsize=30)
plt.ylabel("Accuracy" , fontweight = "bold" , fontsize=30)
plt.tick_params(axis='both', which='major', labelsize=20)
# plt.ylim([0.75,1])
plt.xlim([0,101])
plt.legend( prop={'size':18} , loc = 4)


plt.subplot(1,2,2)
plt.errorbar(range(1,len(model_info_sgd.history['val_acc'])+1),model_info_sgd.history['val_acc'] ,color = "DarkGreen", linestyle = "--" , marker = "v" , label = "SGD")
plt.errorbar(range(1,len(model_info_adam.history['val_acc'])+1),model_info_adam.history['val_acc'] ,color = "navy", linestyle = "--" , marker = "^" , label = "Adam")
plt.errorbar(range(1,len(model_info_nadam.history['val_acc'])+1),model_info_nadam.history['val_acc']  ,color = "red", linestyle = "--" , marker = "s" , label = "Nadam")
plt.errorbar(range(1,len(model_info_adamax.history['val_acc'])+1),model_info_adamax.history['val_acc']  ,color = "cyan", linestyle = "--" , marker = "h" , label = "Adamax")
plt.errorbar(range(1,len(model_info_adadelta.history['val_acc'])+1),model_info_adadelta.history['val_acc'],color = "yellow", linestyle = "--" , marker = ">" , label = "Adadelta")
plt.errorbar(range(1,len(model_info_adagrad.history['val_acc'])+1),model_info_adagrad.history['val_acc'],color = "purple", linestyle = "--" , marker = "<" , label = "Adagrad")
plt.errorbar(range(1,len(model_info_rmsprop.history['val_acc'])+1),model_info_rmsprop.history['val_acc'],color = "darkorange", linestyle = "--" , marker = "o" , label = "RMSprop")

plt.title("Testing" ,  fontweight = "bold" , fontsize=30)

mpl.rcParams['lines.markersize'] = 1
mpl.rcParams['axes.linewidth'] = 3
mpl.rcParams['lines.linewidth'] =3
plt.xlabel("Number of Epochs", fontweight = "bold" , fontsize=30)
plt.ylabel("Accuracy" , fontweight = "bold" , fontsize=30)
plt.tick_params(axis='both', which='major', labelsize=20)
# plt.ylim([0.75,1])
plt.xlim([0,101])
plt.legend( prop={'size':18} , loc = 4)

plt.savefig("./score_all.png" , bbox_inches='tight')
plt.show()
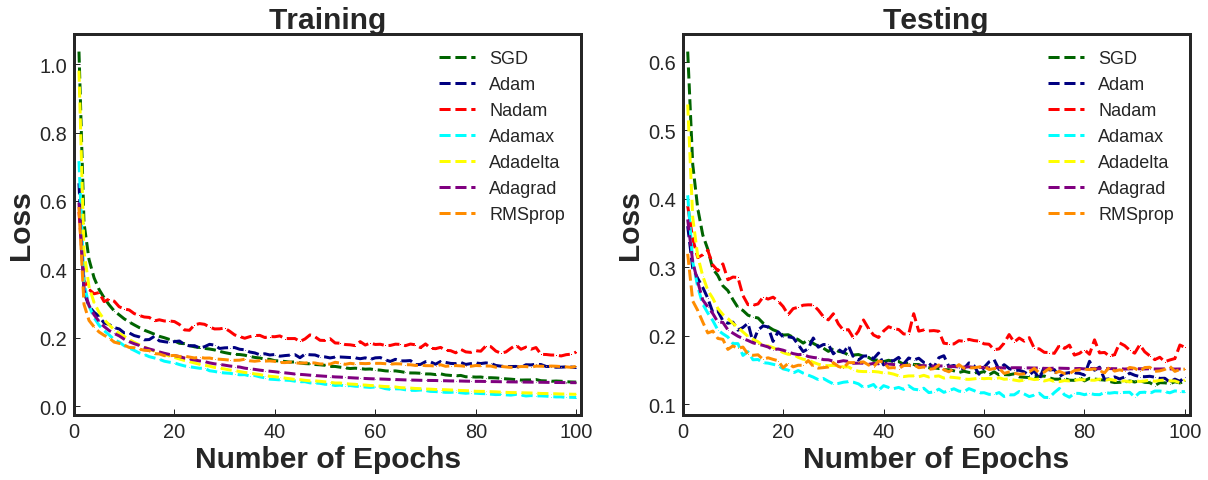
# Plot with Error bars
plt.figure(figsize=(20, 7))

plt.subplot(1,2,1)
plt.errorbar(range(1,len(model_info_sgd.history['loss'])+1),model_info_sgd.history['loss'] ,color = "DarkGreen", linestyle = "--" , marker = "v" , label = "SGD")
plt.errorbar(range(1,len(model_info_adam.history['loss'])+1),model_info_adam.history['loss'] ,color = "navy", linestyle = "--" , marker = "^" , label = "Adam")
plt.errorbar(range(1,len(model_info_nadam.history['loss'])+1),model_info_nadam.history['loss'],color = "red", linestyle = "--" , marker = "s" , label = "Nadam")
plt.errorbar(range(1,len(model_info_adamax.history['loss'])+1),model_info_adamax.history['loss'] ,color = "cyan", linestyle = "--" , marker = "h" , label = "Adamax")
plt.errorbar(range(1,len(model_info_adadelta.history['loss'])+1),model_info_adadelta.history['loss'] ,color = "yellow", linestyle = "--" , marker = ">" , label = "Adadelta")
plt.errorbar(range(1,len(model_info_adagrad.history['loss'])+1),model_info_adagrad.history['loss'],color = "purple", linestyle = "--" , marker = "<" , label = "Adagrad")
plt.errorbar(range(1,len(model_info_rmsprop.history['loss'])+1),model_info_rmsprop.history['loss'],color = "darkorange", linestyle = "--" , marker = "o" , label = "RMSprop")

plt.title("Training" ,  fontweight = "bold" , fontsize=30)

mpl.rcParams['lines.markersize'] = 1
mpl.rcParams['axes.linewidth'] = 3
mpl.rcParams['lines.linewidth'] =3
plt.xlabel("Number of Epochs", fontweight = "bold" , fontsize=30)
plt.ylabel("Loss" , fontweight = "bold" , fontsize=30)
plt.tick_params(axis='both', which='major', labelsize=20)
# plt.ylim([0.75,1])
plt.xlim([0,101])
plt.legend( prop={'size':18} , loc = 1)

plt.subplot(1,2,2)
plt.errorbar(range(1,len(model_info_sgd.history['val_loss'])+1),model_info_sgd.history['val_loss'] ,color = "DarkGreen", linestyle = "--" , marker = "v" , label = "SGD")
plt.errorbar(range(1,len(model_info_adam.history['val_loss'])+1),model_info_adam.history['val_loss'] ,color = "navy", linestyle = "--" , marker = "^" , label = "Adam")
plt.errorbar(range(1,len(model_info_nadam.history['val_loss'])+1),model_info_nadam.history['val_loss'],color = "red", linestyle = "--" , marker = "s" , label = "Nadam")
plt.errorbar(range(1,len(model_info_adamax.history['val_loss'])+1),model_info_adamax.history['val_loss'],color = "cyan", linestyle = "--" , marker = "h" , label = "Adamax")
plt.errorbar(range(1,len(model_info_adadelta.history['val_loss'])+1),model_info_adadelta.history['val_loss'],color = "yellow", linestyle = "--" , marker = ">" , label = "Adadelta")
plt.errorbar(range(1,len(model_info_adagrad.history['val_loss'])+1),model_info_adagrad.history['val_loss'],color = "purple", linestyle = "--" , marker = "<" , label = "Adagrad")
plt.errorbar(range(1,len(model_info_rmsprop.history['val_loss'])+1),model_info_rmsprop.history['val_loss'],color = "darkorange", linestyle = "--" , marker = "o" , label = "RMSprop")

plt.title("Testing" ,  fontweight = "bold" , fontsize=30)

mpl.rcParams['lines.markersize'] = 1
mpl.rcParams['axes.linewidth'] = 3
mpl.rcParams['lines.linewidth'] =3
plt.xlabel("Number of Epochs", fontweight = "bold" , fontsize=30)
plt.ylabel("Loss" , fontweight = "bold" , fontsize=30)
plt.tick_params(axis='both', which='major', labelsize=20)
# plt.ylim([0.75,1])
plt.xlim([0,101])
plt.legend( prop={'size':18} , loc = 1)

plt.savefig("./loss_all.png" ,bbox_inches='tight')
plt.show()
# decrease the learning rate
# define model
import keras
adamax_lr1 = keras.optimizers.Adamax(lr=0.1)
model_adamax_lr01 = simple_nn()
model_adamax_lr01.compile(optimizer=adamax_lr1, loss='mae', metrics=['accuracy'])
start = time.time()
model_info_adamax_lr01 = model_adamax_lr01.fit(train_features, train_labels, batch_size=128, \
                       nb_epoch=100, verbose=0, validation_data=(test_features , test_labels))
end = time.time()
# plot model history
plot_model_history(model_info_adamax_lr01)
print " Model took %0.2f seconds to train"%(end - start)
# compute test accuracy
print "Accuracy on test data is: %0.2f"%accuracy(test_features, test_labels, model_adamax_lr01)
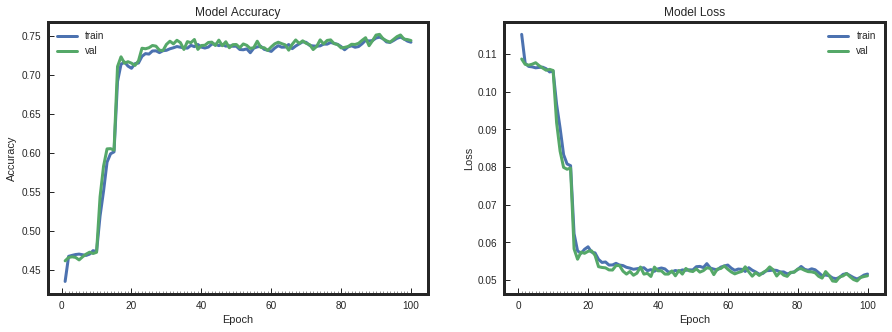
 Model took 277.18 seconds to train
Accuracy on test data is: 74.45
# decrease the learning rate
# define model
import keras
adamax_lr2 = keras.optimizers.Adamax(lr=0.01)
model_adamax_lr2 = simple_nn()
model_adamax_lr2.compile(optimizer=adamax_lr2, loss='mae', metrics=['accuracy'])
start = time.time()
model_info_adamax_lr2 = model_adamax_lr2.fit(train_features, train_labels, batch_size=128, \
                       nb_epoch=100, verbose=0, validation_data=(test_features , test_labels))
end = time.time()
# plot model history
plot_model_history(model_info_adamax_lr2)
print " Model took %0.2f seconds to train"%(end - start)
# compute test accuracy
print "Accuracy on test data is: %0.2f"%accuracy(test_features, test_labels, model_adamax_lr2)
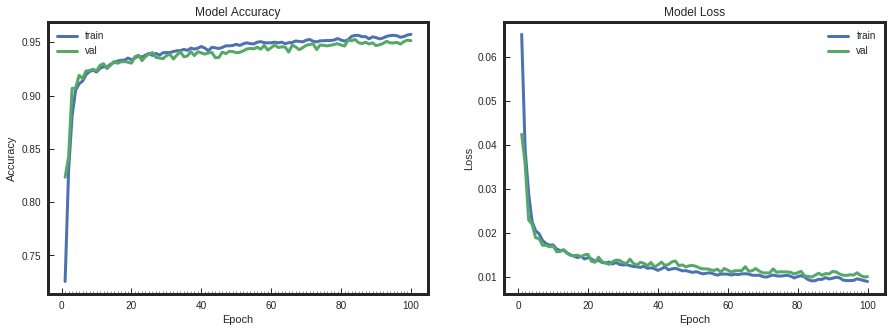
 Model took 216.88 seconds to train
Accuracy on test data is: 95.15
# decrease the learning rate
# define model
import keras
adamax_lr3 = keras.optimizers.Adamax(lr=0.001)
model_adamax_lr3 = simple_nn()
model_adamax_lr3.compile(optimizer=adamax_lr3, loss='mae', metrics=['accuracy'])
start = time.time()
model_info_adamax_lr3 = model_adamax_lr3.fit(train_features, train_labels, batch_size=128, \
                       nb_epoch=100, verbose=0, validation_data=(test_features , test_labels))
end = time.time()
# plot model history
plot_model_history(model_info_adamax_lr3)
print " Model took %0.2f seconds to train"%(end - start)
# compute test accuracy
print "Accuracy on test data is: %0.2f"%accuracy(test_features, test_labels, model_adamax_lr3)
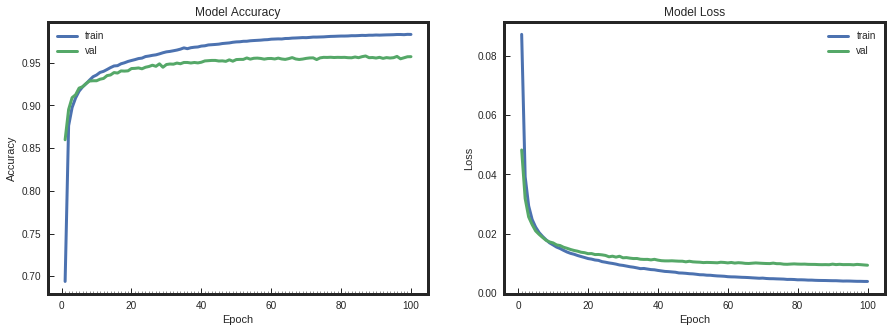
 Model took 161.09 seconds to train
Accuracy on test data is: 95.71
# decrease the learning rate
# define model
import keras
adamax_lr4 = keras.optimizers.Adamax(lr=0.1)
model_adamax_lr4 = simple_nn()
model_adamax_lr4.compile(optimizer=adamax_lr4, loss='mse', metrics=['accuracy'])
start = time.time()
model_info_adamax_lr4 = model_adamax_lr4.fit(train_features, train_labels, batch_size=128, \
                       nb_epoch=100, verbose=0, validation_data=(test_features , test_labels))
end = time.time()
# plot model history
plot_model_history(model_info_adamax_lr4)
print " Model took %0.2f seconds to train"%(end - start)
# compute test accuracy
print "Accuracy on test data is: %0.2f"%accuracy(test_features, test_labels, model_adamax_lr4)
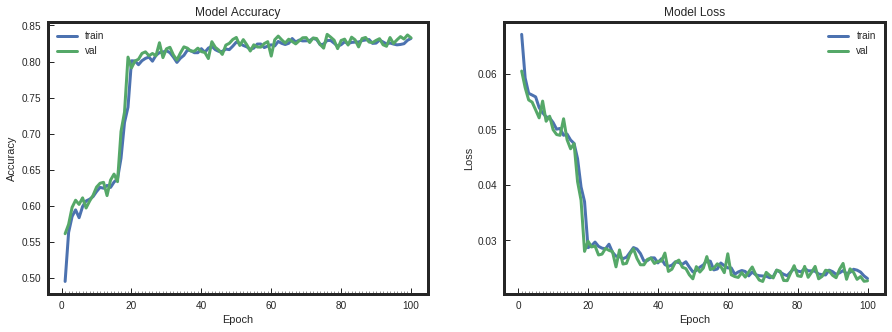
 Model took 327.13 seconds to train
Accuracy on test data is: 83.28
# decrease the learning rate
# define model
import keras
adamax_lr5 = keras.optimizers.Adamax(lr=0.01)
model_adamax_lr5 = simple_nn()
model_adamax_lr5.compile(optimizer=adamax_lr5, loss='mse', metrics=['accuracy'])
start = time.time()
model_info_adamax_lr5 = model_adamax_lr5.fit(train_features, train_labels, batch_size=128, \
                       nb_epoch=100, verbose=0, validation_data=(test_features , test_labels))
end = time.time()
# plot model history
plot_model_history(model_info_adamax_lr5)
print " Model took %0.2f seconds to train"%(end - start)
# compute test accuracy
print "Accuracy on test data is: %0.2f"%accuracy(test_features, test_labels, model_adamax_lr5)
 Model took 208.68 seconds to train
Accuracy on test data is: 95.77
# decrease the learning rate
# define model
import keras
adamax_lr6 = keras.optimizers.Adamax(lr=0.001)
model_adamax_lr6 = simple_nn()
model_adamax_lr6.compile(optimizer=adamax_lr6, loss='mse', metrics=['accuracy'])
start = time.time()
model_info_adamax_lr6 = model_adamax_lr6.fit(train_features, train_labels, batch_size=128, \
                       nb_epoch=100, verbose=0, validation_data=(test_features , test_labels))
end = time.time()
# plot model history
plot_model_history(model_info_adamax_lr6)
print " Model took %0.2f seconds to train"%(end - start)
# compute test accuracy
print "Accuracy on test data is: %0.2f"%accuracy(test_features, test_labels, model_adamax_lr6)
 Model took 148.24 seconds to train
Accuracy on test data is: 96.00
# decrease the learning rate
# define model
import keras
adamax_lr7 = keras.optimizers.Adamax(lr=0.1)
model_adamax_lr7 = simple_nn()
model_adamax_lr7.compile(optimizer=adamax_lr7, loss='categorical_crossentropy', metrics=['accuracy'])
start = time.time()
model_info_adamax_lr7 = model_adamax_lr7.fit(train_features, train_labels, batch_size=128, \
                       nb_epoch=100, verbose=0, validation_data=(test_features , test_labels))
end = time.time()
# plot model history
plot_model_history(model_info_adamax_lr7)
print " Model took %0.2f seconds to train"%(end - start)
# compute test accuracy
print "Accuracy on test data is: %0.2f"%accuracy(test_features, test_labels, model_adamax_lr7)
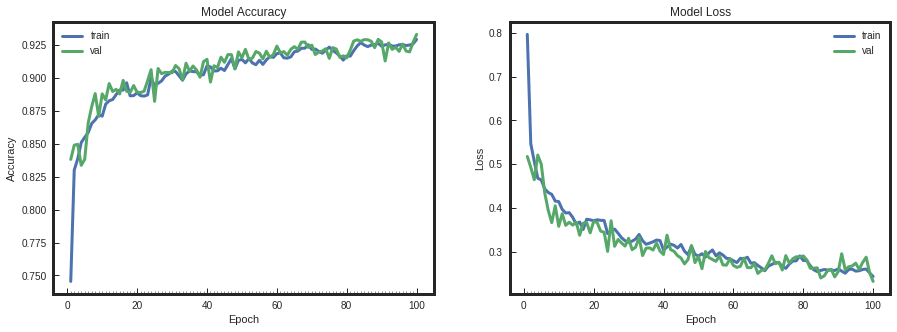
 Model took 280.57 seconds to train
Accuracy on test data is: 93.28
# decrease the learning rate
# define model
import keras
adamax_lr8 = keras.optimizers.Adamax(lr=0.01)
model_adamax_lr8 = simple_nn()
model_adamax_lr8.compile(optimizer=adamax_lr8, loss='categorical_crossentropy', metrics=['accuracy'])
start = time.time()
model_info_adamax_lr8 = model_adamax_lr8.fit(train_features, train_labels, batch_size=128, \
                       nb_epoch=100, verbose=0, validation_data=(test_features , test_labels))
end = time.time()
# plot model history
plot_model_history(model_info_adamax_lr8)
print " Model took %0.2f seconds to train"%(end - start)
# compute test accuracy
print "Accuracy on test data is: %0.2f"%accuracy(test_features, test_labels, model_adamax_lr8)
 Model took 183.22 seconds to train
Accuracy on test data is: 95.96
# decrease the learning rate
# define model
import keras
adamax_lr9 = keras.optimizers.Adamax(lr=0.001)
model_adamax_lr9 = simple_nn()
model_adamax_lr9.compile(optimizer=adamax_lr9, loss='categorical_crossentropy', metrics=['accuracy'])
start = time.time()
model_info_adamax_lr9 = model_adamax_lr9.fit(train_features, train_labels, batch_size=128, \
                       nb_epoch=100, verbose=0, validation_data=(test_features , test_labels))
end = time.time()
# plot model history
plot_model_history(model_info_adamax_lr9)
print " Model took %0.2f seconds to train"%(end - start)
# compute test accuracy
print "Accuracy on test data is: %0.2f"%accuracy(test_features, test_labels, model_adamax_lr9)
 Model took 165.88 seconds to train
Accuracy on test data is: 95.82
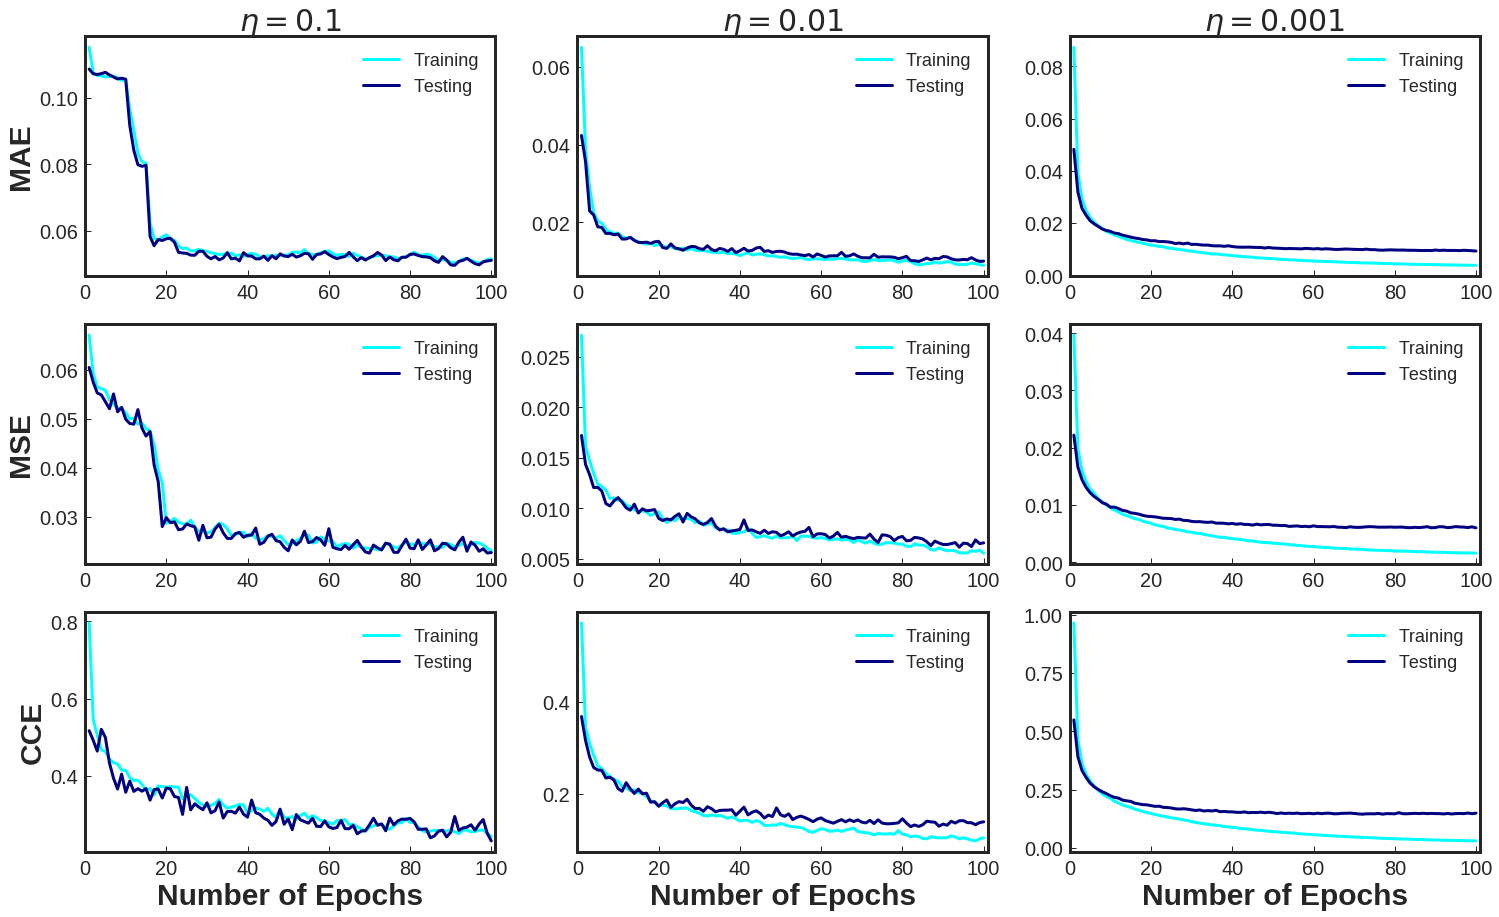
# learning effect - epochs
plt.figure(figsize=(25, 15))


plt.subplot(3,3,1)
plt.errorbar(range(1,len(model_info_adamax_lr01.history['loss'])+1),model_info_adamax_lr01.history['loss'] ,color = "cyan", linestyle = "-" , marker = "v" , label = "Training")
plt.errorbar(range(1,len(model_info_adamax_lr01.history['val_loss'])+1),model_info_adamax_lr01.history['val_loss'] ,color = "navy", linestyle = "-" , marker = "^" , label = "Testing")

plt.title(r"$\eta = 0.1$" ,  fontweight = "bold" , fontsize=30)

mpl.rcParams['lines.markersize'] = 1
mpl.rcParams['axes.linewidth'] = 3
mpl.rcParams['lines.linewidth'] =3
# plt.xlabel("Number of Epochs", fontweight = "bold" , fontsize=30)
plt.ylabel("MAE" , fontweight = "bold" , fontsize=30)
plt.tick_params(axis='both', which='major', labelsize=20)
# plt.ylim([0.75,1])
plt.xlim([0,101])
plt.legend( prop={'size':18} , loc = 1)


plt.subplot(3,3,2)
plt.errorbar(range(1,len(model_info_adamax_lr2.history['loss'])+1),model_info_adamax_lr2.history['loss'] ,color = "cyan", linestyle = "-" , marker = "v" , label = "Training")
plt.errorbar(range(1,len(model_info_adamax_lr2.history['val_loss'])+1),model_info_adamax_lr2.history['val_loss'] ,color = "navy", linestyle = "-" , marker = "^" , label = "Testing")

plt.title(r"$\eta = 0.01$" ,  fontweight = "bold" , fontsize=30)

mpl.rcParams['lines.markersize'] = 1
mpl.rcParams['axes.linewidth'] = 3
mpl.rcParams['lines.linewidth'] =3
# plt.xlabel("Number of Epochs", fontweight = "bold" , fontsize=30)
# plt.ylabel("Loss" , fontweight = "bold" , fontsize=30)
plt.tick_params(axis='both', which='major', labelsize=20)
# plt.ylim([0.75,1])
plt.xlim([0,101])
plt.legend( prop={'size':18} , loc = 1)

plt.subplot(3,3,3)
plt.errorbar(range(1,len(model_info_adamax_lr3.history['loss'])+1),model_info_adamax_lr3.history['loss'] ,color = "cyan", linestyle = "-" , marker = "v" , label = "Training")
plt.errorbar(range(1,len(model_info_adamax_lr3.history['val_loss'])+1),model_info_adamax_lr3.history['val_loss'] ,color = "navy", linestyle = "-" , marker = "^" , label = "Testing")

plt.title(r"$\eta = 0.001$" ,  fontweight = "bold" , fontsize=30)

mpl.rcParams['lines.markersize'] = 1
mpl.rcParams['axes.linewidth'] = 3
mpl.rcParams['lines.linewidth'] =3
# plt.xlabel("Number of Epochs", fontweight = "bold" , fontsize=30)
# plt.ylabel("Loss" , fontweight = "bold" , fontsize=30)
plt.tick_params(axis='both', which='major', labelsize=20)
# plt.ylim([0.75,1])
plt.xlim([0,101])
plt.legend( prop={'size':18} , loc = 1)

plt.subplot(3,3,4)
plt.errorbar(range(1,len(model_info_adamax_lr4.history['loss'])+1),model_info_adamax_lr4.history['loss'] ,color = "cyan", linestyle = "-" , marker = "v" , label = "Training")
plt.errorbar(range(1,len(model_info_adamax_lr4.history['val_loss'])+1),model_info_adamax_lr4.history['val_loss'] ,color = "navy", linestyle = "-" , marker = "^" , label = "Testing")

# plt.title("Testing" ,  fontweight = "bold" , fontsize=30)

mpl.rcParams['lines.markersize'] = 1
mpl.rcParams['axes.linewidth'] = 3
mpl.rcParams['lines.linewidth'] =3
# plt.xlabel("Number of Epochs", fontweight = "bold" , fontsize=30)
plt.ylabel("MSE" , fontweight = "bold" , fontsize=30)
plt.tick_params(axis='both', which='major', labelsize=20)
# plt.ylim([0.75,1])
plt.xlim([0,101])
plt.legend( prop={'size':18} , loc = 1)


plt.subplot(3,3,5)
plt.errorbar(range(1,len(model_info_adamax_lr5.history['loss'])+1),model_info_adamax_lr5.history['loss'] ,color = "cyan", linestyle = "-" , marker = "v" , label = "Training")
plt.errorbar(range(1,len(model_info_adamax_lr5.history['val_loss'])+1),model_info_adamax_lr5.history['val_loss'] ,color = "navy", linestyle = "-" , marker = "^" , label = "Testing")

# plt.title("Testing" ,  fontweight = "bold" , fontsize=30)

mpl.rcParams['lines.markersize'] = 1
mpl.rcParams['axes.linewidth'] = 3
mpl.rcParams['lines.linewidth'] =3
# plt.xlabel("Number of Epochs", fontweight = "bold" , fontsize=30)
# plt.ylabel("Loss" , fontweight = "bold" , fontsize=30)
plt.tick_params(axis='both', which='major', labelsize=20)
# plt.ylim([0.75,1])
plt.xlim([0,101])
plt.legend( prop={'size':18} , loc = 1)


plt.subplot(3,3,6)
plt.errorbar(range(1,len(model_info_adamax_lr6.history['loss'])+1),model_info_adamax_lr6.history['loss'] ,color = "cyan", linestyle = "-" , marker = "v" , label = "Training")
plt.errorbar(range(1,len(model_info_adamax_lr6.history['val_loss'])+1),model_info_adamax_lr6.history['val_loss'] ,color = "navy", linestyle = "-" , marker = "^" , label = "Testing")

# plt.title("Testing" ,  fontweight = "bold" , fontsize=30)

mpl.rcParams['lines.markersize'] = 1
mpl.rcParams['axes.linewidth'] = 3
mpl.rcParams['lines.linewidth'] =3
# plt.xlabel("Number of Epochs", fontweight = "bold" , fontsize=30)
# plt.ylabel("Loss" , fontweight = "bold" , fontsize=30)
plt.tick_params(axis='both', which='major', labelsize=20)
# plt.ylim([0.75,1])
plt.xlim([0,101])
plt.legend( prop={'size':18} , loc = 1)


plt.subplot(3,3,7)
plt.errorbar(range(1,len(model_info_adamax_lr7.history['loss'])+1),model_info_adamax_lr7.history['loss'] ,color = "cyan", linestyle = "-" , marker = "v" , label = "Training")
plt.errorbar(range(1,len(model_info_adamax_lr7.history['val_loss'])+1),model_info_adamax_lr7.history['val_loss'] ,color = "navy", linestyle = "-" , marker = "^" , label = "Testing")

# plt.title("Testing" ,  fontweight = "bold" , fontsize=30)

mpl.rcParams['lines.markersize'] = 1
mpl.rcParams['axes.linewidth'] = 3
mpl.rcParams['lines.linewidth'] =3
plt.xlabel("Number of Epochs", fontweight = "bold" , fontsize=30)
plt.ylabel("CCE" , fontweight = "bold" , fontsize=30)
plt.tick_params(axis='both', which='major', labelsize=20)
# plt.ylim([0.75,1])
plt.xlim([0,101])
plt.legend( prop={'size':18} , loc = 1)


plt.subplot(3,3,8)
plt.errorbar(range(1,len(model_info_adamax_lr8.history['loss'])+1),model_info_adamax_lr8.history['loss'] ,color = "cyan", linestyle = "-" , marker = "v" , label = "Training")
plt.errorbar(range(1,len(model_info_adamax_lr8.history['val_loss'])+1),model_info_adamax_lr8.history['val_loss'] ,color = "navy", linestyle = "-" , marker = "^" , label = "Testing")

# plt.title("Testing" ,  fontweight = "bold" , fontsize=30)

mpl.rcParams['lines.markersize'] = 1
mpl.rcParams['axes.linewidth'] = 3
mpl.rcParams['lines.linewidth'] =3
plt.xlabel("Number of Epochs", fontweight = "bold" , fontsize=30)
# plt.ylabel("Loss" , fontweight = "bold" , fontsize=30)
plt.tick_params(axis='both', which='major', labelsize=20)
# plt.ylim([0.75,1])
plt.xlim([0,101])
plt.legend( prop={'size':18} , loc = 1)


plt.subplot(3,3,9)
plt.errorbar(range(1,len(model_info_adamax_lr9.history['loss'])+1),model_info_adamax_lr9.history['loss'] ,color = "cyan", linestyle = "-" , marker = "v" , label = "Training")
plt.errorbar(range(1,len(model_info_adamax_lr9.history['val_loss'])+1),model_info_adamax_lr9.history['val_loss'] ,color = "navy", linestyle = "-" , marker = "^" , label = "Testing")

# plt.title("Testing" ,  fontweight = "bold" , fontsize=30)

mpl.rcParams['lines.markersize'] = 1
mpl.rcParams['axes.linewidth'] = 3
mpl.rcParams['lines.linewidth'] =3
plt.xlabel("Number of Epochs", fontweight = "bold" , fontsize=30)
# plt.ylabel("Loss" , fontweight = "bold" , fontsize=30)
plt.tick_params(axis='both', which='major', labelsize=20)
# plt.ylim([0.75,1])
plt.xlim([0,101])
plt.legend( prop={'size':18} , loc = 1)

plt.savefig("./LR.png" ,bbox_inches='tight')
plt.show()# Plot with Error bars
# decrease the learning rate
# define model
import keras
adamax_b1 = keras.optimizers.Adamax(lr=0.001)
model_adamax_b1 = simple_nn()
model_adamax_b1.compile(optimizer=adamax_b1, loss='mae', metrics=['accuracy'])
start = time.time()
model_info_adamax_b1 = model_adamax_b1.fit(train_features, train_labels, batch_size=16, \
                       nb_epoch=100, verbose=0, validation_data=(test_features , test_labels))
end = time.time()
# plot model history
plot_model_history(model_info_adamax_b1)
print " Model took %0.2f seconds to train"%(end - start)
# compute test accuracy
print "Accuracy on test data is: %0.2f"%accuracy(test_features, test_labels, model_adamax_b1)
 Model took 526.42 seconds to train
Accuracy on test data is: 96.13
# decrease the learning rate
# define model
import keras
adamax_b2 = keras.optimizers.Adamax(lr=0.001)
model_adamax_b2 = simple_nn()
model_adamax_b2.compile(optimizer=adamax_b2, loss='mae', metrics=['accuracy'])
start = time.time()
model_info_adamax_b2 = model_adamax_b2.fit(train_features, train_labels, batch_size=64, \
                       nb_epoch=100, verbose=0, validation_data=(test_features , test_labels))
end = time.time()
# plot model history
plot_model_history(model_info_adamax_b2)
print " Model took %0.2f seconds to train"%(end - start)
# compute test accuracy
print "Accuracy on test data is: %0.2f"%accuracy(test_features, test_labels, model_adamax_b2)
 Model took 207.72 seconds to train
Accuracy on test data is: 95.56
# decrease the learning rate
# define model
import keras
adamax_b3 = keras.optimizers.Adamax(lr=0.001)
model_adamax_b3 = simple_nn()
model_adamax_b3.compile(optimizer=adamax_b3, loss='mae', metrics=['accuracy'])
start = time.time()
model_info_adamax_b3 = model_adamax_b3.fit(train_features, train_labels, batch_size=256, \
                       nb_epoch=100, verbose=0, validation_data=(test_features , test_labels))
end = time.time()
# plot model history
plot_model_history(model_info_adamax_b3)
print " Model took %0.2f seconds to train"%(end - start)
# compute test accuracy
print "Accuracy on test data is: %0.2f"%accuracy(test_features, test_labels, model_adamax_b3)
 Model took 135.38 seconds to train
Accuracy on test data is: 95.17
# decrease the learning rate
# define model
import keras
adamax_b4 = keras.optimizers.Adamax(lr=0.001)
model_adamax_b4 = simple_nn()
model_adamax_b4.compile(optimizer=adamax_b4, loss='mse', metrics=['accuracy'])
start = time.time()
model_info_adamax_b4 = model_adamax_b4.fit(train_features, train_labels, batch_size=16, \
                       nb_epoch=100, verbose=0, validation_data=(test_features , test_labels))
end = time.time()
# plot model history
plot_model_history(model_info_adamax_b4)
print " Model took %0.2f seconds to train"%(end - start)
# compute test accuracy
print "Accuracy on test data is: %0.2f"%accuracy(test_features, test_labels, model_adamax_b4)
 Model took 518.54 seconds to train
Accuracy on test data is: 96.21
# decrease the learning rate
# define model
import keras
adamax_b5 = keras.optimizers.Adamax(lr=0.001)
model_adamax_b5 = simple_nn()
model_adamax_b5.compile(optimizer=adamax_b5, loss='mse', metrics=['accuracy'])
start = time.time()
model_info_adamax_b5 = model_adamax_b5.fit(train_features, train_labels, batch_size=64, \
                       nb_epoch=100, verbose=0, validation_data=(test_features , test_labels))
end = time.time()
# plot model history
plot_model_history(model_info_adamax_b5)
print " Model took %0.2f seconds to train"%(end - start)
# compute test accuracy# decrease the learning rate
# define model
import keras
adamax_b5 = keras.optimizers.Adamax(lr=0.001)
model_adamax_b5 = simple_nn()
model_adamax_b5.compile(optimizer=adamax_b5, loss='mse', metrics=['accuracy'])
start = time.time()
model_info_adamax_b5 = model_adamax_b5.fit(train_features, train_labels, batch_size=64, \
                       nb_epoch=100, verbose=0, validation_data=(test_features , test_labels))
end = time.time()
# plot model history
plot_model_history(model_info_adamax_b5)
print " Model took %0.2f seconds to train"%(end - start)
# compute test accuracy
print "Accuracy on test data is: %0.2f"%accuracy(test_features, test_labels, model_adamax_b5)
print "Accuracy on test data is: %0.2f"%accuracy(test_features, test_labels, model_adamax_b5)
 Model took 201.08 seconds to train
Accuracy on test data is: 95.77
# decrease the learning rate
# define model
import keras
adamax_b6 = keras.optimizers.Adamax(lr=0.001)
model_adamax_b6 = simple_nn()
model_adamax_b6.compile(optimizer=adamax_b6, loss='mse', metrics=['accuracy'])
start = time.time()
model_info_adamax_b6 = model_adamax_b6.fit(train_features, train_labels, batch_size=256, \
                       nb_epoch=100, verbose=0, validation_data=(test_features , test_labels))
end = time.time()
# plot model history
plot_model_history(model_info_adamax_b6)
print " Model took %0.2f seconds to train"%(end - start)
# compute test accuracy
print "Accuracy on test data is: %0.2f"%accuracy(test_features, test_labels, model_adamax_b6)
 Model took 122.64 seconds to train
Accuracy on test data is: 95.55
# decrease the learning rate
# define model
import keras
adamax_b7 = keras.optimizers.Adamax(lr=0.001)
model_adamax_b7 = simple_nn()
model_adamax_b7.compile(optimizer=adamax_b7, loss='categorical_crossentropy', metrics=['accuracy'])
start = time.time()
model_info_adamax_b7 = model_adamax_b7.fit(train_features, train_labels, batch_size=16, \
                       nb_epoch=100, verbose=0, validation_data=(test_features , test_labels))
end = time.time()
# plot model history
plot_model_history(model_info_adamax_b7)
print " Model took %0.2f seconds to train"%(end - start)
# compute test accuracy
print "Accuracy on test data is: %0.2f"%accuracy(test_features, test_labels, model_adamax_b7)
 Model took 1142.46 seconds to train
Accuracy on test data is: 96.42
# decrease the learning rate
# define model
import keras
adamax_b8 = keras.optimizers.Adamax(lr=0.001)
model_adamax_b8 = simple_nn()
model_adamax_b8.compile(optimizer=adamax_b8, loss='categorical_crossentropy', metrics=['accuracy'])
start = time.time()
model_info_adamax_b8 = model_adamax_b8.fit(train_features, train_labels, batch_size=64, \
                       nb_epoch=100, verbose=0, validation_data=(test_features , test_labels))
end = time.time()
# plot model history
plot_model_history(model_info_adamax_b8)
print " Model took %0.2f seconds to train"%(end - start)
# compute test accuracy
print "Accuracy on test data is: %0.2f"%accuracy(test_features, test_labels, model_adamax_b8)
 Model took 611.61 seconds to train
Accuracy on test data is: 95.84
# decrease the learning rate
# define model
import keras
adamax_b9 = keras.optimizers.Adamax(lr=0.001)
model_adamax_b9 = simple_nn()
model_adamax_b9.compile(optimizer=adamax_b9, loss='categorical_crossentropy', metrics=['accuracy'])
start = time.time()
model_info_adamax_b9 = model_adamax_b9.fit(train_features, train_labels, batch_size=256, \
                       nb_epoch=100, verbose=0, validation_data=(test_features , test_labels))
end = time.time()
# plot model history
plot_model_history(model_info_adamax_b9)
print " Model took %0.2f seconds to train"%(end - start)
# compute test accuracy
print "Accuracy on test data is: %0.2f"%accuracy(test_features, test_labels, model_adamax_b9)
 Model took 332.20 seconds to train
Accuracy on test data is: 95.86
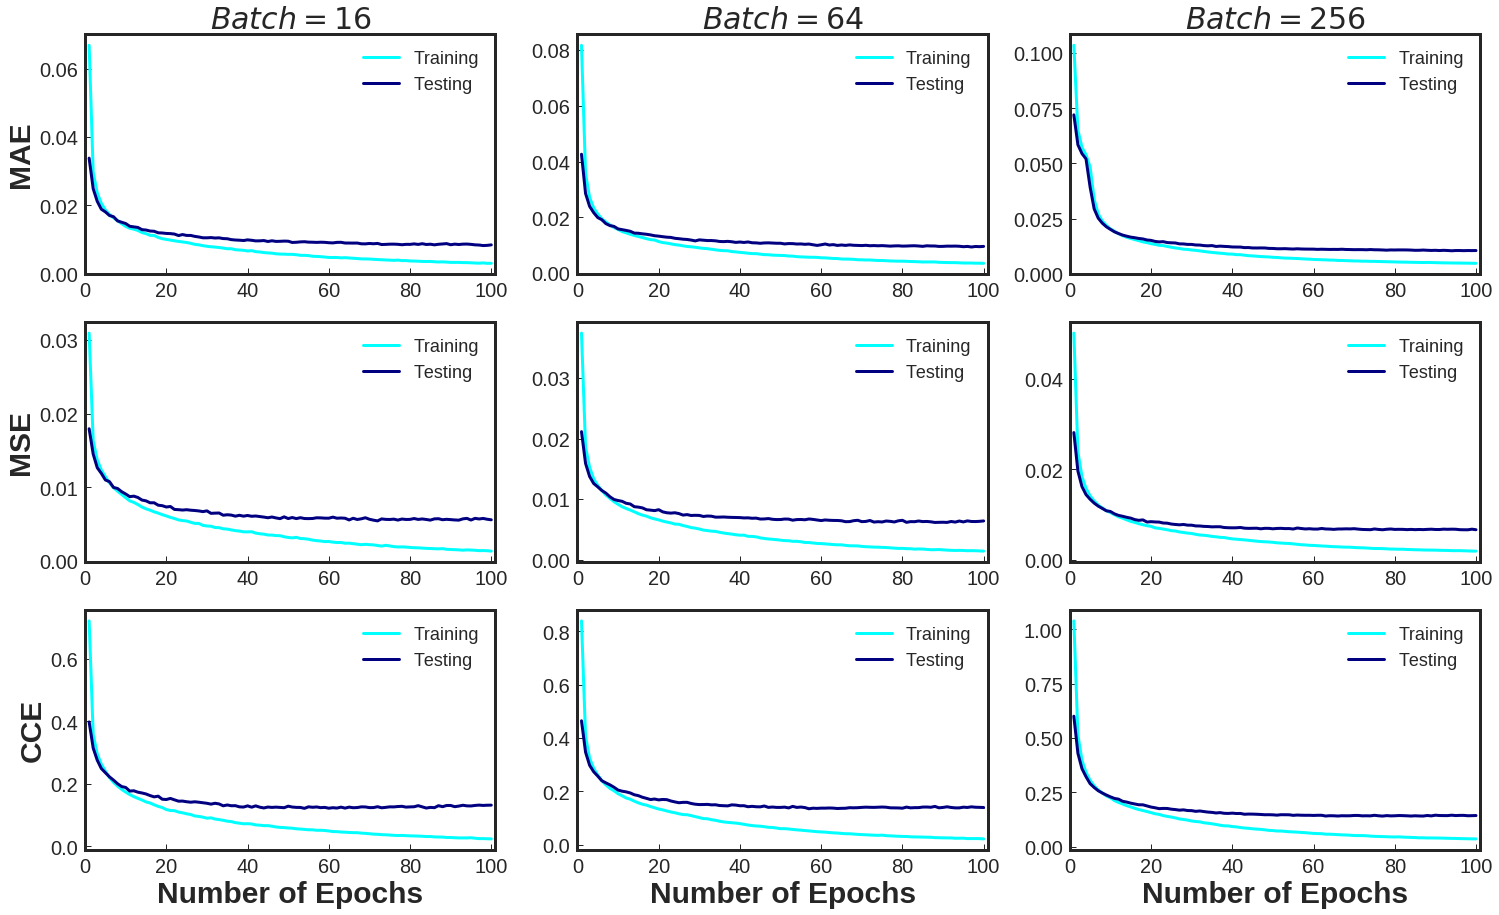
# batch size vs epochs
plt.figure(figsize=(25, 15))


plt.subplot(3,3,1)
plt.errorbar(range(1,len(model_info_adamax_b1.history['loss'])+1),model_info_adamax_b1.history['loss'] ,color = "cyan", linestyle = "-" , marker = "v" , label = "Training")
plt.errorbar(range(1,len(model_info_adamax_b1.history['val_loss'])+1),model_info_adamax_b1.history['val_loss'] ,color = "navy", linestyle = "-" , marker = "^" , label = "Testing")

plt.title("$Batch = 16$" ,  fontweight = "bold" , fontsize=30)

mpl.rcParams['lines.markersize'] = 1
mpl.rcParams['axes.linewidth'] = 3
mpl.rcParams['lines.linewidth'] =3
# plt.xlabel("Number of Epochs", fontweight = "bold" , fontsize=30)
plt.ylabel("MAE" , fontweight = "bold" , fontsize=30)
plt.tick_params(axis='both', which='major', labelsize=20)
# plt.ylim([0.75,1])
plt.xlim([0,101])
plt.legend( prop={'size':18} , loc = 1)


plt.subplot(3,3,2)
plt.errorbar(range(1,len(model_info_adamax_b2.history['loss'])+1),model_info_adamax_b2.history['loss'] ,color = "cyan", linestyle = "-" , marker = "v" , label = "Training")
plt.errorbar(range(1,len(model_info_adamax_b2.history['val_loss'])+1),model_info_adamax_b2.history['val_loss'] ,color = "navy", linestyle = "-" , marker = "^" , label = "Testing")

plt.title("$Batch = 64$" ,  fontweight = "bold" , fontsize=30)

mpl.rcParams['lines.markersize'] = 1
mpl.rcParams['axes.linewidth'] = 3
mpl.rcParams['lines.linewidth'] =3
# plt.xlabel("Number of Epochs", fontweight = "bold" , fontsize=30)
# plt.ylabel("Loss" , fontweight = "bold" , fontsize=30)
plt.tick_params(axis='both', which='major', labelsize=20)
# plt.ylim([0.75,1])
plt.xlim([0,101])
plt.legend( prop={'size':18} , loc = 1)


plt.subplot(3,3,3)
plt.errorbar(range(1,len(model_info_adamax_b3.history['loss'])+1),model_info_adamax_b3.history['loss'] ,color = "cyan", linestyle = "-" , marker = "v" , label = "Training")
plt.errorbar(range(1,len(model_info_adamax_b3.history['val_loss'])+1),model_info_adamax_b3.history['val_loss'] ,color = "navy", linestyle = "-" , marker = "^" , label = "Testing")

plt.title("$Batch = 256$" ,  fontweight = "bold" , fontsize=30)

mpl.rcParams['lines.markersize'] = 1
mpl.rcParams['axes.linewidth'] = 3
mpl.rcParams['lines.linewidth'] =3
# plt.xlabel("Number of Epochs", fontweight = "bold" , fontsize=30)
# plt.ylabel("Loss" , fontweight = "bold" , fontsize=30)
plt.tick_params(axis='both', which='major', labelsize=20)
# plt.ylim([0.75,1])
plt.xlim([0,101])
plt.legend( prop={'size':18} , loc = 1)


plt.subplot(3,3,4)
plt.errorbar(range(1,len(model_info_adamax_b4.history['loss'])+1),model_info_adamax_b4.history['loss'] ,color = "cyan", linestyle = "-" , marker = "v" , label = "Training")
plt.errorbar(range(1,len(model_info_adamax_b4.history['val_loss'])+1),model_info_adamax_b4.history['val_loss'] ,color = "navy", linestyle = "-" , marker = "^" , label = "Testing")

# plt.title("Testing" ,  fontweight = "bold" , fontsize=30)

mpl.rcParams['lines.markersize'] = 1
mpl.rcParams['axes.linewidth'] = 3
mpl.rcParams['lines.linewidth'] =3
# plt.xlabel("Number of Epochs", fontweight = "bold" , fontsize=30)
plt.ylabel("MSE" , fontweight = "bold" , fontsize=30)
plt.tick_params(axis='both', which='major', labelsize=20)
# plt.ylim([0.75,1])
plt.xlim([0,101])
plt.legend( prop={'size':18} , loc = 1)


plt.subplot(3,3,5)
plt.errorbar(range(1,len(model_info_adamax_b5.history['loss'])+1),model_info_adamax_b5.history['loss'] ,color = "cyan", linestyle = "-" , marker = "v" , label = "Training")
plt.errorbar(range(1,len(model_info_adamax_b5.history['val_loss'])+1),model_info_adamax_b5.history['val_loss'] ,color = "navy", linestyle = "-" , marker = "^" , label = "Testing")

# plt.title("Testing" ,  fontweight = "bold" , fontsize=30)

mpl.rcParams['lines.markersize'] = 1
mpl.rcParams['axes.linewidth'] = 3
mpl.rcParams['lines.linewidth'] =3
# plt.xlabel("Number of Epochs", fontweight = "bold" , fontsize=30)
# plt.ylabel("Loss" , fontweight = "bold" , fontsize=30)
plt.tick_params(axis='both', which='major', labelsize=20)
# plt.ylim([0.75,1])
plt.xlim([0,101])
plt.legend( prop={'size':18} , loc = 1)


plt.subplot(3,3,6)
plt.errorbar(range(1,len(model_info_adamax_b6.history['loss'])+1),model_info_adamax_b6.history['loss'] ,color = "cyan", linestyle = "-" , marker = "v" , label = "Training")
plt.errorbar(range(1,len(model_info_adamax_b6.history['val_loss'])+1),model_info_adamax_b6.history['val_loss'] ,color = "navy", linestyle = "-" , marker = "^" , label = "Testing")

# plt.title("Testing" ,  fontweight = "bold" , fontsize=30)

mpl.rcParams['lines.markersize'] = 1
mpl.rcParams['axes.linewidth'] = 3
mpl.rcParams['lines.linewidth'] =3
# plt.xlabel("Number of Epochs", fontweight = "bold" , fontsize=30)
# plt.ylabel("Loss" , fontweight = "bold" , fontsize=30)
plt.tick_params(axis='both', which='major', labelsize=20)
# plt.ylim([0.75,1])
plt.xlim([0,101])
plt.legend( prop={'size':18} , loc = 1)


plt.subplot(3,3,7)
plt.errorbar(range(1,len(model_info_adamax_b7.history['loss'])+1),model_info_adamax_b7.history['loss'] ,color = "cyan", linestyle = "-" , marker = "v" , label = "Training")
plt.errorbar(range(1,len(model_info_adamax_b7.history['val_loss'])+1),model_info_adamax_b7.history['val_loss'] ,color = "navy", linestyle = "-" , marker = "^" , label = "Testing")

# plt.title("Testing" ,  fontweight = "bold" , fontsize=30)

mpl.rcParams['lines.markersize'] = 1
mpl.rcParams['axes.linewidth'] = 3
mpl.rcParams['lines.linewidth'] =3
plt.xlabel("Number of Epochs", fontweight = "bold" , fontsize=30)
plt.ylabel("CCE" , fontweight = "bold" , fontsize=30)
plt.tick_params(axis='both', which='major', labelsize=20)
# plt.ylim([0.75,1])
plt.xlim([0,101])
plt.legend( prop={'size':18} , loc = 1)


plt.subplot(3,3,8)
plt.errorbar(range(1,len(model_info_adamax_b8.history['loss'])+1),model_info_adamax_b8.history['loss'] ,color = "cyan", linestyle = "-" , marker = "v" , label = "Training")
plt.errorbar(range(1,len(model_info_adamax_b8.history['val_loss'])+1),model_info_adamax_b8.history['val_loss'] ,color = "navy", linestyle = "-" , marker = "^" , label = "Testing")

# plt.title("Testing" ,  fontweight = "bold" , fontsize=30)

mpl.rcParams['lines.markersize'] = 1
mpl.rcParams['axes.linewidth'] = 3
mpl.rcParams['lines.linewidth'] =3
plt.xlabel("Number of Epochs", fontweight = "bold" , fontsize=30)
# plt.ylabel("Loss" , fontweight = "bold" , fontsize=30)
plt.tick_params(axis='both', which='major', labelsize=20)
# plt.ylim([0.75,1])
plt.xlim([0,101])
plt.legend( prop={'size':18} , loc = 1)


plt.subplot(3,3,9)
plt.errorbar(range(1,len(model_info_adamax_b9.history['loss'])+1),model_info_adamax_b9.history['loss'] ,color = "cyan", linestyle = "-" , marker = "v" , label = "Training")
plt.errorbar(range(1,len(model_info_adamax_b9.history['val_loss'])+1),model_info_adamax_b9.history['val_loss'] ,color = "navy", linestyle = "-" , marker = "^" , label = "Testing")

# plt.title("Testing" ,  fontweight = "bold" , fontsize=30)

mpl.rcParams['lines.markersize'] = 1
mpl.rcParams['axes.linewidth'] = 3
mpl.rcParams['lines.linewidth'] =3
plt.xlabel("Number of Epochs", fontweight = "bold" , fontsize=30)
# plt.ylabel("Loss" , fontweight = "bold" , fontsize=30)
plt.tick_params(axis='both', which='major', labelsize=20)
# plt.ylim([0.75,1])
plt.xlim([0,101])
plt.legend( prop={'size':18} , loc = 1)

plt.savefig("./Batch.png" ,bbox_inches='tight')
plt.show()# Plot with Error bars