Bayesian Optimization For XGBoost

XGBoost has many hyper-paramters which need to be tuned to have an optimum model. There are many ways to find these tuned parameters such as grid-search or random search. However, bayesian optimization makes it easier and faster for us.
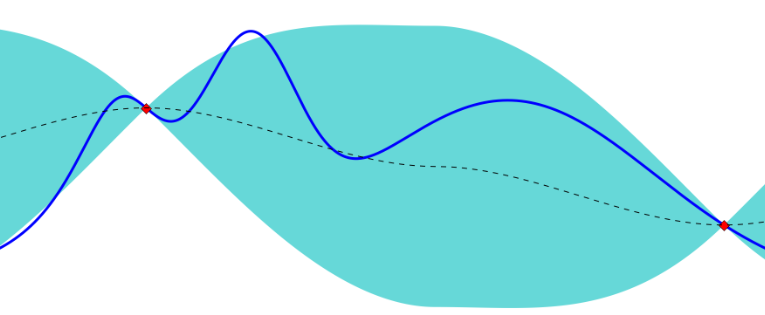
Gaussian processes (GPs) provide a principled, practical, and probabilistic approach in machine learning. GPs simply have an essential assumption that similar inputs give similar outputs. This simple and weak prior are actually very sensible for the effects of hyper-parameters. GPs are able to learn for each input dimension what the appropriate scale is for measuring similarity. GPs predict a Gaussian distribution of values rather than just predicting a single value. Bayesian optimization is a constrained global optimization approach built upon Bayesian inference and Gaussian process models to find the maximum value of an unknown function in the most efficient ways (less iterations).
# Loading libraries
from bayes_opt import BayesianOptimization as bo
import xgboost as xgb
import numpy as np
import pandas as pd
import matplotlib.pyplot as plt
from sklearn.preprocessing import scale
import warnings
warnings.simplefilter("ignore")
from IPython.core.display import display, HTML
display(HTML("<style>.container { width:95% !important; }</style>"))
import seaborn as sns
sns.set_style("ticks")
%matplotlib inline
Bayesian Optimization
def _my_bayesian_optimization(X, Y, n_iter = 5,
                                       init_points = 5,
                                       acq = "ei",
                                       num_boost_round = 1000,
                                       nfold = 10,
                                       stratified = True,
                                       metrics = ("auc"),
                                       early_stopping_rounds = 20,
                                       seed = 1367,
                                       shuffle = True,
                                       show_stdv = False,
                                       pbounds = None,
                                       importance_type = "total_gain",
                                       callbacks = False,
                                       verbose_eval = False):
    """
    a function to run bayesian optimization for xgboost
    input parameters:
                    X: features (pandas dataframe or numpy array)
                    Y: targets (1D array or list)
                    n_iter: total number of bayesian iterations (default = 5)
                    init_points: total initial points of optimization (default = 5)
                    acq
                    num_boost_rounds: max number of boosting rounds, (default = 1000)
                    stratified: stratificaiton of the targets (default = True)
                    metrics: classification/regression metrics (default = ("auc))
                    early_stopping_rounds: the criteria for stopping if the test metric is not improved (default = 20)
                    seed: random seed (default = 1367)
                    shuffle: shuffling the data (default = True)
                    show_stdv = showing standard deviation of cv results (default = False)
                    pbounds = set of parameters for bayesian optimization of xgboost cv
                            (default_params = {
                                               "eval_metric" : "auc",
                                               "tree_method": "hist",
                                               "objective" : "binary:logistic",
                                               "learning_rate" : 0.05,
                                               "max_depth": 2,
                                               "min_child_weight": 1,
                                               "gamma" : 0.0,
                                               "reg_alpha" : 0.0,
                                               "reg_lambda" : 1.0,
                                               "subsample" : 0.9,
                                               "max_delta_step": 1,
                                               "silent" : 1,
                                               "nthread" : 4,
                                               "scale_pos_weight" : 1
                                               }
                            )
                    importance_type = importance type of xgboost as string (default = "total_gain")
                                      the other options will be "weight", "gain", "cover", and "total_cover"
                    callbacks = printing callbacks for xgboost cv
                                (defaults = False, if True: [xgb.callback.print_evaluation(show_stdv = show_stdv),
                                                             xgb.callback.early_stop(early_stopping_rounds)])
                    verbose_eval : a flag to show the result during train on train/test sets (default = False)
    outputs:
            df_res: the parameters related to the best performance
            xgb_params: a dictionary of the best parameters of xgboost


    """


    # callback flag
    if(callbacks == True):
        callbacks = [xgb.callback.print_evaluation(show_stdv = show_stdv),
                     xgb.callback.early_stop(early_stopping_rounds)]
    else:
        callbacks = None

    # pbounds
    default_pbounds = {"max_depth" : (2, 5),
                       "learning_rate" : (0, 1),
                       "min_child_weight" : (1, 20),
                       "subsample" : (0.1, 1),
                       "gamma": (0, 1),
                       "colsample_bytree": (0.1, 1.0)
                      }

    # updating the default parameters of the pbounds
    if pbounds is not None:
        for key, val in pbounds.items():
            default_pbounds[key] = val


    def __xgb_eval(learning_rate,
                   max_depth,
                   gamma,
                   colsample_bytree,
                   min_child_weight,
                   subsample):

        params = {"eval_metric" : "auc",
                  "tree_method": "hist",
                  "objective" : "binary:logistic",
                  "max_delta_step": 1,
                  "silent" : 1,
                  "nthread" : 4,
                  "scale_pos_weight" : 1,
                  "reg_alpha" : 0.0,
                  "reg_lambda" : 1.0,
                  "learning_rate" : learning_rate,
                  "max_depth": int(max_depth),
                  "min_child_weight": min_child_weight,
                  "gamma" : gamma,
                  "subsample" : subsample,
                  "colsample_bytree" : colsample_bytree
                 }
        dtrain = xgb.DMatrix(data = X, label = Y)
        cv_result = xgb.cv(params = params,
                           dtrain = dtrain,
                           num_boost_round = num_boost_round,
                           nfold = nfold,
                           stratified = stratified,
                           metrics = metrics,
                           early_stopping_rounds = early_stopping_rounds,
                           seed = seed,
                           verbose_eval = verbose_eval,
                           shuffle = shuffle,
                           callbacks = callbacks)

        return cv_result.iloc[-1][2]


    xgb_bo = bo(__xgb_eval, default_pbounds, random_state = seed, verbose = 2)
    xgb_bo.maximize(init_points = init_points, n_iter = n_iter, acq = acq)


    targets = []
    for i, rs in enumerate(xgb_bo.res):
        targets.append(rs["target"])
    best_params = xgb_bo.res[targets.index(max(targets))]["params"]
    best_params["max_depth"] = int(best_params["max_depth"])

    xgb_params = {"eval_metric" : "auc",
                  "tree_method": "hist",
                  "objective" : "binary:logistic",
                  "max_delta_step": 1,
                  "silent" : 1,
                  "nthread" : 4,
                  "scale_pos_weight" : 1,
                  "reg_alpha" : 0.0,
                  "reg_lambda" : 1.0,
                  "learning_rate" : 0.05,
                  "max_depth": 2,
                  "min_child_weight": 5,
                  "gamma" : 0.0,
                  "subsample" : 1.0,
                  "colsample_bytree" : 0.9
                 }
    for key, val in best_params.items():
        xgb_params[key] = val

    dtrain = xgb.DMatrix(data = X, label = Y)
    bst = xgb.train(params = xgb_params,
                    dtrain = dtrain,
                    num_boost_round = num_boost_round)

    # build results dataframe
    frames = []
    for idx, res in enumerate(xgb_bo.res):
        d = res['params']
        d[metrics] = res["target"]
        frames.append(pd.DataFrame(data = d, index = [idx]))

    res_df = pd.concat(frames)

    print(F"-*-*-*-*-*-* Optimization Results -*-*-*-*-*-*")
    display(res_df)

    # Plotting
    import matplotlib as mpl

    mpl.rcParams['axes.linewidth'] = 3
    mpl.rcParams['lines.linewidth'] = 3
    cols = [col for col in res_df.columns.tolist() if col != "auc"]
    ip = 1
    plt.figure(figsize = (22, 10))
    colors = ["navy", "lavender", "lightblue", "cyan", "cadetblue", "slateblue"]
    for col in cols:
        res_df.sort_values(by = col, inplace=True)
        plt.subplot(2,3,ip)
        plt.plot(res_df.loc[:, col], res_df.loc[:, metrics], color = colors[ip-1])
        plt.xlabel(F"{col}", fontsize = 20)
        plt.ylabel(F"{metrics}", fontsize = 20)
        plt.tick_params(axis='both', which='major', labelsize = 12)
        ip += 1
    plt.show()

    print(F"-*-*-*-*-*-* Best Performance -*-*-*-*-*-*")
    display(res_df.loc[res_df[metrics] == res_df[metrics].max(), :])

    from xgboost import plot_importance
    from pylab import rcParams
    rcParams['figure.figsize'] = (10,10)
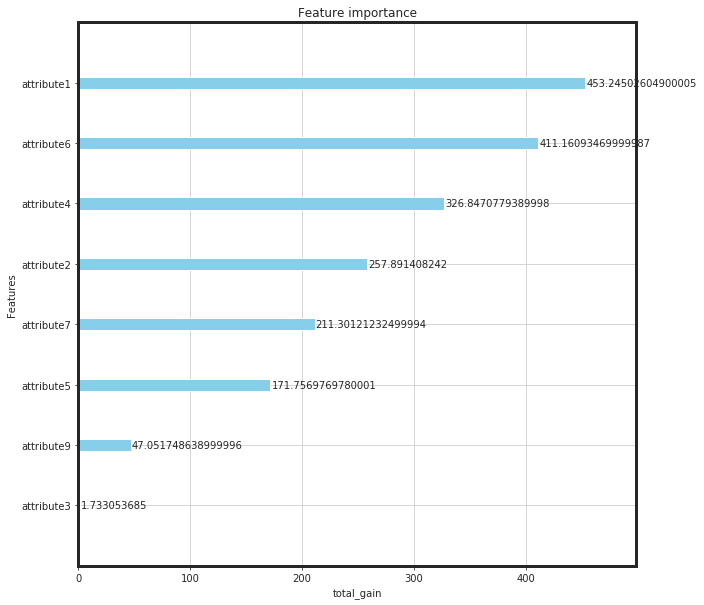
    plot_importance(bst, importance_type = importance_type, color = "skyblue", xlabel = importance_type)
    plt.show()

    return res_df, xgb_params


def _x_y_maker(df, target, to_drop):
    """
    A function to receive the dataframe and make the X, and Y matrices:
    ----------
    parameters

    input: dataframe df
           string target (class label)
           list[string] to_drop (list of columns need to be dropped)

    output: dataframe Feature matrix (df_X)
            Target vector (Y)
    """
    Targets = df[target]
    to_drop.append(target)
    Features = df.drop(to_drop, axis = 1)
    Scaled_Features = scale(Features.values)
    df_X = pd.DataFrame(data = Scaled_Features, columns = Features.columns.tolist())
    Y = Targets.values

    return df_X, Y
Loading Data
dateparser = lambda x: pd.datetime.strptime(x, "%Y-%m-%d")
df_raw = pd.read_csv("./device_failure.csv",
                     parse_dates = ["date"],
                     date_parser = dateparser,
                     encoding = "cp1252")

print("Shape: {}".format(df_raw.shape))
print("Prevalence = {:.3f}%".format(df_raw["failure"].sum()/df_raw.shape[0] * 100))
Shape: (124494, 12)
Prevalence = 0.085%
df_raw.head()
| date | device | failure | attribute1 | attribute2 | attribute3 | attribute4 | attribute5 | attribute6 | attribute7 | attribute8 | attribute9 | |
|---|---|---|---|---|---|---|---|---|---|---|---|---|
| 0 | 2015-01-01 | S1F01085 | 0 | 215630672 | 56 | 0 | 52 | 6 | 407438 | 0 | 0 | 7 |
| 1 | 2015-01-01 | S1F0166B | 0 | 61370680 | 0 | 3 | 0 | 6 | 403174 | 0 | 0 | 0 |
| 2 | 2015-01-01 | S1F01E6Y | 0 | 173295968 | 0 | 0 | 0 | 12 | 237394 | 0 | 0 | 0 |
| 3 | 2015-01-01 | S1F01JE0 | 0 | 79694024 | 0 | 0 | 0 | 6 | 410186 | 0 | 0 | 0 |
| 4 | 2015-01-01 | S1F01R2B | 0 | 135970480 | 0 | 0 | 0 | 15 | 313173 | 0 | 0 | 3 |
df = df_raw.copy()
target = "failure"
to_drop = ["date", "device", "attribute8"]
df_X, Y = _x_y_maker(df, target, to_drop)
df_res, params = _my_bayesian_optimization(df_X, Y)
| iter | target | colsam... | gamma | learni... | max_depth | min_ch... | subsample |
-------------------------------------------------------------------------------------------------
| [0m 1 [0m | [0m 0.8795 [0m | [0m 0.8975 [0m | [0m 0.04571 [0m | [0m 0.6628 [0m | [0m 3.343 [0m | [0m 1.436 [0m | [0m 0.3758 [0m |
| [0m 2 [0m | [0m 0.844 [0m | [0m 0.7422 [0m | [0m 0.1034 [0m | [0m 0.7671 [0m | [0m 3.934 [0m | [0m 18.39 [0m | [0m 0.3402 [0m |
| [0m 3 [0m | [0m 0.8697 [0m | [0m 0.206 [0m | [0m 0.7772 [0m | [0m 0.269 [0m | [0m 4.909 [0m | [0m 16.83 [0m | [0m 0.6439 [0m |
| [95m 4 [0m | [95m 0.8894 [0m | [95m 0.7187 [0m | [95m 0.9302 [0m | [95m 0.7736 [0m | [95m 2.183 [0m | [95m 10.72 [0m | [95m 0.6848 [0m |
| [95m 5 [0m | [95m 0.8912 [0m | [95m 0.7297 [0m | [95m 0.8513 [0m | [95m 0.4627 [0m | [95m 3.654 [0m | [95m 4.965 [0m | [95m 0.9395 [0m |
| [0m 6 [0m | [0m 0.5 [0m | [0m 0.1 [0m | [0m 1.0 [0m | [0m 0.0 [0m | [0m 2.0 [0m | [0m 3.543 [0m | [0m 0.1 [0m |
| [0m 7 [0m | [0m 0.8746 [0m | [0m 1.0 [0m | [0m 0.0 [0m | [0m 1.0 [0m | [0m 5.0 [0m | [0m 8.494 [0m | [0m 1.0 [0m |
| [0m 8 [0m | [0m 0.8899 [0m | [0m 1.0 [0m | [0m 0.0 [0m | [0m 1.0 [0m | [0m 5.0 [0m | [0m 1.0 [0m | [0m 1.0 [0m |
| [0m 9 [0m | [0m 0.5 [0m | [0m 1.0 [0m | [0m 1.0 [0m | [0m 0.0 [0m | [0m 2.0 [0m | [0m 15.37 [0m | [0m 1.0 [0m |
| [0m 10 [0m | [0m 0.5 [0m | [0m 0.1 [0m | [0m 1.0 [0m | [0m 1.0 [0m | [0m 5.0 [0m | [0m 20.0 [0m | [0m 0.1 [0m |
=================================================================================================
-*-*-*-*-*-* Optimization Results -*-*-*-*-*-*
| colsample_bytree | gamma | learning_rate | max_depth | min_child_weight | subsample | auc | |
|---|---|---|---|---|---|---|---|
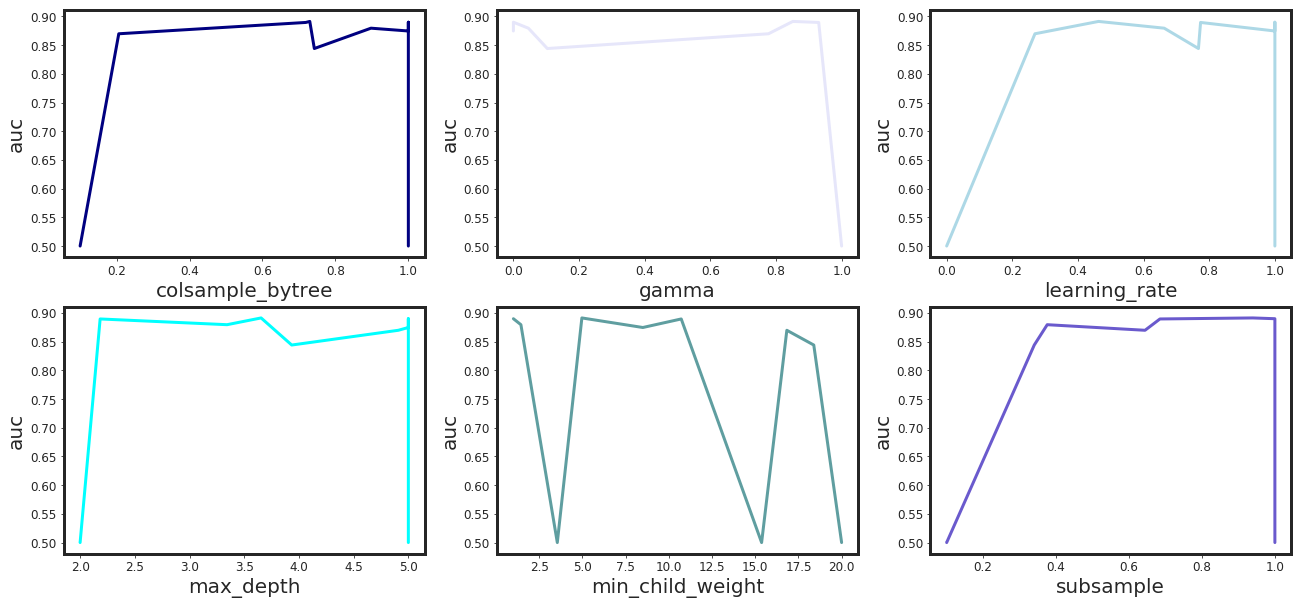
| 0 | 0.897530 | 0.045712 | 0.662807 | 3.343081 | 1.435660 | 0.375782 | 0.879458 |
| 1 | 0.742226 | 0.103395 | 0.767115 | 3.934126 | 18.388615 | 0.340209 | 0.844032 |
| 2 | 0.206024 | 0.777161 | 0.269010 | 4.908585 | 16.829513 | 0.643933 | 0.869726 |
| 3 | 0.718692 | 0.930205 | 0.773597 | 2.183002 | 10.716203 | 0.684811 | 0.889447 |
| 4 | 0.729727 | 0.851274 | 0.462704 | 3.654198 | 4.964748 | 0.939488 | 0.891218 |
| 5 | 0.100000 | 1.000000 | 0.000000 | 2.000000 | 3.542604 | 0.100000 | 0.500000 |
| 6 | 1.000000 | 0.000000 | 1.000000 | 5.000000 | 8.493812 | 1.000000 | 0.874567 |
| 7 | 1.000000 | 0.000000 | 1.000000 | 5.000000 | 1.000000 | 1.000000 | 0.889880 |
| 8 | 1.000000 | 1.000000 | 0.000000 | 2.000000 | 15.368715 | 1.000000 | 0.500000 |
| 9 | 0.100000 | 1.000000 | 1.000000 | 5.000000 | 20.000000 | 0.100000 | 0.500000 |

-*-*-*-*-*-* Best Performance -*-*-*-*-*-*
| colsample_bytree | gamma | learning_rate | max_depth | min_child_weight | subsample | auc | |
|---|---|---|---|---|---|---|---|
| 4 | 0.729727 | 0.851274 | 0.462704 | 3.654198 | 4.964748 | 0.939488 | 0.891218 |

Best XGBoost Parameters
params
{'eval_metric': 'auc',
 'tree_method': 'hist',
 'objective': 'binary:logistic',
 'max_delta_step': 1,
 'silent': 1,
 'nthread': 4,
 'scale_pos_weight': 1,
 'reg_alpha': 0.0,
 'reg_lambda': 1.0,
 'learning_rate': 0.46270355802290863,
 'max_depth': 3,
 'min_child_weight': 4.964747561175287,
 'gamma': 0.8512735546087907,
 'subsample': 0.9394881696342923,
 'colsample_bytree': 0.7297272989171456}